|
WiTMeMo '05 Paper
[WiTMeMo '05 Technical Program]


An Experimental Study of Multimedia Traffic Performance
in Mesh Networks
Yuan Sun
Irfan Sheriff
Elizabeth M. Belding-Royer Kevin C. Almeroth
Department of Computer Science
University of California, Santa Barbara
{suny, isheriff, ebelding, almeroth}@cs.ucsb.edu
Abstract
Performance evaluation and analysis of wireless networks is essential
because testbed experiments facilitate a better understanding of network
and application characteristics. This understanding of performance, in turn,
results in robust protocol design. In this paper, we present an
experimental study of multimedia traffic performance in mesh networks. We
evaluate the performance of video and voice traffic through multi-hop
wireless paths and study the capacity of the mesh network.
We also investigate the impact of different traffic and network characteristics
on application performance. The impact of different
wireless network interface card configurations is examined, followed by our suggestions
for how to improve performance. We believe our study is beneficial for both wireless
network capacity planning and robust protocol design for wireless applications
and services. Other researchers can also draw upon our traffic measurement
experience for their own mesh testbed experiments.
Introduction
The growing deployment of wireless technology and infrastructure is enabling a variety of new applications. These applications
require flexible and robust network support.
For instance, multimedia applications, which include video streaming, VoIP and online
gaming, often demand seamless real-time data delivery. These requirements, in turn, necessitate
that both the
application and the network be able to adapt to the highly
variable nature of wireless channels. Evaluation and analysis of the performance of
these applications on wireless networks therefore becomes increasingly critical
so that the network and application characteristics can be better understood.
Such understanding also
facilitates robust protocol design for the future wireless Internet.
The majority of wireless research to date has been conducted using simulations which
offer
an efficient and flexible means to evaluate new protocols using fine-grained control.
However,
in simulations, MAC protocol models are often simplified, ideal wireless channels
are assumed without consideration of background noise and random interference, and
unrealistic traffic traces are utilized. Consequently,
evaluation through simulation may not reflect the performance obtained in real networks.
As a result of the inaccuracy of simulations, many researchers have begun deploying
multi-hop mesh networks for use in wireless network protocol development
and testing.
Testbed experiments can be challenging due to the effort required to
install,
configure and manage the hardware [5]. In addition, performance results
are often affected by the specific configurations and protocol settings.
Given the significant
number of possible parameters that can affect results,
finding a representative set of parameter values
is non-trivial. Furthermore, the highly varying characteristics of wireless links often lead to
unstable and unrepeatable results. Significant effort is necessary to enable repeatable tests
and to establish adequate methods for collecting and analyzing the testbed data.
In this paper, we present our experimental study of multimedia traffic performance
in mesh networks. Multimedia applications are examined because they represent
a growing percentage of Internet traffic and applications.
These applications demand
more stringent service quality with low delay and
jitter. Specifically, we perform tests consisting of video
streams and voice traffic over the UCSB MeshNet testbed (https://moment.cs.ucsb.edu/meshnet).
We evaluate the
performance of the delivery of the multimedia data through multi-hop wireless paths and study the capacity
of the mesh network. We also examine the impact of different traffic and
network characteristics on application performance. Specifically, we compare the performance
of bursty video traffic with constant bit rate voice traffic. We also investigate the impact of
different wireless network interface card configurations. We believe our study is beneficial in both wireless network
capacity planning and protocol design.
We describe our analysis methodology and utilities so that other researchers can
draw upon our experience for their own mesh testbed experiments.
The remainder of this paper is organized as follows. Section 2
briefly introduces the UCSB MeshNet testbed and describes
the set of tools we used for our experiments. Section 3
describes the experimental setup and the evaluation metrics. Section 4 presents the experimental results and
performance analysis. Finally, Section 5
discusses our observation and concludes the paper.
UCSB MeshNet Testbed
The UCSB MeshNet testbed is a wireless mesh network deployed on the campus
of UC Santa Barbara. The network consists of 25 nodes equipped with IEEE 802.11b
wireless radios. The nodes are distributed on five floors of the Engineering I
building. The purpose of the testbed is to evaluate
protocols and systems designed for the robust operation of multi-hop wireless networks.
The UCSB MeshNet testbed consists of two different types of nodes.
Our
experiments are conducted on one type of node, called Mesh Gateways, which are
off-the-shelf Intel Celeron
2.4GHz machines running Linux version 2.4.20. The machines use wireless utilities
version 16 and the hostap driver for communicating with the Netgate 2511 PCMCIA
802.11b radios. The 802.11b radios operate in ad hoc mode and connect the wireless mesh nodes. Each node is also equipped with an Ethernet interface to provide
Internet access to the mesh devices and to allow out-of-band management of the
mesh gateway [5].
We utilize existing
tools such as iwpriv to set the pseudo BSSID and lock the cell because otherwise
BSSID changes occur frequently in the tests and significantly impact the results.
iptables is also used for packet filtering and route configurations.
To facilitate repeatable experiments and accurate data analysis, we also
developed
two utilities for network monitoring and diagnosis.
Link reliability test tool:
We perform link reliability tests between node pairs. The
goals are to 1) measure the link quality of individual hops, and 2)
identify any asymmetric links. To test reliability,
the packet delivery rate in both the forward and backward direction of a link
are measured. The measurements are done
by sending periodic broadcast packets and recording
the number of packets successfully received at each
neighbor during a given period of time.
Broadcast packets are used because MAC layer retransmissions do not occur
for broadcast packets and thus these packets
can be used to estimate the raw packet delivery rate.
A link is considered symmetric if
the packet delivery rate on both the forward and reverse path
is above 70%.
We perform each test multiple times and identify node pairs that have reliable bi-directional links.
We use these node pairs for our experiments.
We also verify the reliability of
the links before and after each test run to ensure that the link quality is consistent with
our long term measurements.
Time synchronization tool:
In our performance analysis, time synchronization between the mesh nodes is needed
for delay and bandwidth calculations. The multimedia traffic cannot be utilized itself because it uses UDP as the
transport layer protocol. It is thus
one-way, i.e., no ACKs are provided. Therefore, the packet transmission delay
needs to be measured by the destination.
Further, because asymmetric links
frequently occur in wireless networks, round trip latency does not provide a consistent,
accurate measurement of one-way delay.
Therefore, time synchronization is critical for mesh testbed
experiments.
We initially applied the Network Time Protocol (NTP) [4] to eliminate the clock
skew among the mesh nodes. However, our results show that the NTP synchronization precision
is tens of milliseconds. This level of accuracy is not sufficient for our data analysis.
Thus, we developed a tool to calculate the time difference of two machines by utilizing the
wired management links of the mesh nodes. These links connect to the local area network in the
Engineering I building.
Specifically, our tool transmits consecutive 4-byte probe packets that include the
timestamp of the source node. Upon reception of these probing packets,
the destination node records the
timestamp and echos a 4-byte packet containing the time difference between the two
timestamps. At the same time, the source also sends 4-byte probe packets to measure the
round trip latency. The real clock difference between the two nodes is the difference
transmitted by the destination minus half of the round trip latency. We repeat the tests
ten times.
Our measurements indicate that, in the local area wired network, the average round
trip latency and the time difference calculation have less than 10  error. error.
Experimental Setup
In this section, we describe our experimental setup, including the network configuration
and traffic characteristics of both video and voice applications. We also explain the set of experiments we performed
and the evaluation metrics.
Network Topology
We utilize the reliability test tools described in Section 2 to identify the
node pairs with the most reliable bi-directional connections.
From the results, we select a sequence of five nodes that form a four-hop path.
Two of the selected nodes are located in neighboring labs on the second floor and
a third node is across the hallway. The other two nodes are located on the third floor.
We then update the routing tables of these nodes with static route entries
to form paths from one to four hops.
Application Traffic
We examine the performance of multimedia traffic over the mesh network. Specifically, we
use UDP video and voice streams recorded with RTPtools [1].
We use rtpplay for streaming at the source
node and rtpdump to record the packets received at the destination.
Voice traffic follows a constant bit rate (CBR) with an 80-byte voice packet
transmitted every  using G.711 codec,
resulting in a data rate of using G.711 codec,
resulting in a data rate of  .
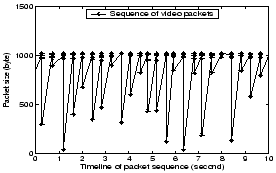
Video traffic, on the other hand, tends to be more bursty.
Figure 1 plots a 10-second sample trace of a video source.
The source transmits between two and three frames of data every
second, where each frame consists of between three and seven .
Video traffic, on the other hand, tends to be more bursty.
Figure 1 plots a 10-second sample trace of a video source.
The source transmits between two and three frames of data every
second, where each frame consists of between three and seven  packets.
These packets are typically sent within a couple of milliseconds.
H.261 codec is used for the video traffic and the average bit rate is packets.
These packets are typically sent within a couple of milliseconds.
H.261 codec is used for the video traffic and the average bit rate is  . .
Figure 1:
Sample video packet sizes transmitted by the source.
 |
MAC Layer Configurations
In our experiments, all nodes operate in ad hoc mode on Channel 6 and
use a static routing topology. The primary
configuration parameters that we vary during the experiments focus on the wireless network interface cards.
Specifically, we perform tests with the card operating at
a fixed data rate ( ) and auto rate (auto-rate adaptation
at 1, 2, 5.5 and ) and auto rate (auto-rate adaptation
at 1, 2, 5.5 and  ). In the auto-rate tests, the date rate increases
as the number of successfully delivered packets increases. Conversely,
the transmission rate decreases when the number of packet errors increases. This mechanism is called Auto Rate Fallback (ARF)
and is specified in the IEEE 802.11b standard [6].
We also investigate the impact of
both the Request To Send/Clear To Send (RTS/CTS) mechanism and the maximum number of retransmissions.
By default, the maximum number of retransmissions per packet is set to seven for small packets
and four for large packets. RTS/CTS is recommended for large data packets1. ). In the auto-rate tests, the date rate increases
as the number of successfully delivered packets increases. Conversely,
the transmission rate decreases when the number of packet errors increases. This mechanism is called Auto Rate Fallback (ARF)
and is specified in the IEEE 802.11b standard [6].
We also investigate the impact of
both the Request To Send/Clear To Send (RTS/CTS) mechanism and the maximum number of retransmissions.
By default, the maximum number of retransmissions per packet is set to seven for small packets
and four for large packets. RTS/CTS is recommended for large data packets1.
Our tests are performed at night so that the impact of random interference (e.g.,
background noise, people and traffic on other wireless networks) is minimized.
We also collect results during the day to examine the impact of these factors.
We conduct the following set of experiments:
- We examine the impact of auto-rate adaptation of the wireless card by
varying the data rate setting to be either fixed or auto-rate.
In this scenario, the RTS/CTS is disabled and the maximum MAC retransmission number is set to seven.
- We study the impact of RTS/CTS by comparing the performance
with the RTS/CTS
feature either enabled or disabled. In this scenario, the data rate is fixed at and
the maximum number of retransmissions is seven.
- We investigate the impact of the number of transmissions by varying the maximum retransmission
value. In this scenario, the RTS/CTS is disabled and the data rate is fixed.
The metrics used to evaluate performance are:
- Packet latency: the end-to-end packet transmission latency.
- Packet loss rate: the percentage of packets that are not successfully received at the destination.
- Inter-flow fairness: indicated by the variation of delay or loss among competing flows.
- Packet jitter: indicated by the variation of inter-arrival latency for packets of individual flows.
Experiment Results
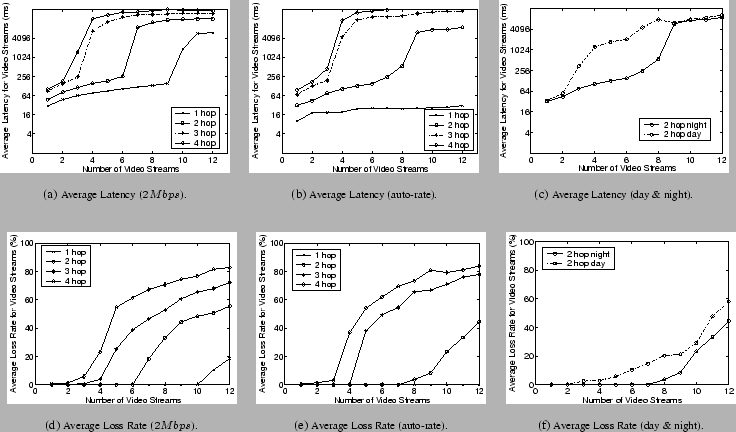
Figure 2:
Performance with increasing number of video streams.
 |
In this section, we evaluate the
performance of video and audio traffic through multi-hop wireless paths and study the capacity
of the mesh network. We also examine the impact of different traffic and
network characteristics on the application performance. Further, we show the impact of
different wireless network interface card configurations.
Capacity
Table 1 shows the number of video and voice flows that the mesh
network supports as the number of hops increases.
For video data, we consider less than  packet loss acceptable. If a more
resilient coding scheme is utilized, it is possible that a higher loss rate will be tolerable.
For voice data, we consider packet loss acceptable. If a more
resilient coding scheme is utilized, it is possible that a higher loss rate will be tolerable.
For voice data, we consider  as the interactive
voice delay threshold [3].
We tested the performance with the
the NIC set to a fixed data rate () and with auto-rate adaptation. as the interactive
voice delay threshold [3].
We tested the performance with the
the NIC set to a fixed data rate () and with auto-rate adaptation.
Table 1:
Number of supported, concurrent flows at acceptable quality.
|
Traffic |
Video |
Voice |
|
hops |
1 |
2 |
3 |
4 |
1 |
2 |
3 |
4 |
|
Auto |
30 |
9 |
3 |
2 |
11 |
6 |
3 |
2 |
|
Fixed () |
10 |
6 |
3 |
2 |
11 |
4 |
3 |
2 |
Intuitively, the network should support more voice traffic flows than video traffic
because voice uses a lower date rate. However, as can be seen in Table 1,
this is not the case.
Instead, the packet sennding rate plays a more important role
in determining the capacity. Specifically, voice traffic has a higher packet generation rate of
100 pkts/second, while the bursty video traffic has an average rate of about 16 pkts/second.
The higher sending rate leads to network congestion, while the packet size has
negligible impact on the number of supportable flows in the network. To verify the impact
of packet sizes, we also performed experiments with  byte voice packets. This results in
a bit rate of byte voice packets. This results in
a bit rate of  .
The results indicate that the same number of flows
are supported regardless of whether the rate is or . .
The results indicate that the same number of flows
are supported regardless of whether the rate is or .
Figure 2
shows the average packet delivery latency and
loss rate for video traffic with a fixed data rate (Figures 2(a) and (d))
and auto-rate (Figures 2(b) and (e)).
We do not include the results for voice traffic because they are similar except that
voice traffic in general incurs low delivery latency due to small packet sizes.
We observe that as the length of the transmission path increases, the performance degrades and
the latency and loss rate increase. However, the increase is non-linear
due to the increased interference from neighboring nodes.
The network capacity is constrained by the number of hops.
From the results, we also observe that increasing the transmission rate of the card
does not necessarily increase
the capacity. For instance, the number of flows supported with the auto-rate feature (with
maximum rate = ) is close to that of the fixed data rate () in multi-hop scenarios,
especially for voice flows
with a large hop count. This result occurs because of the increased contention from
neighboring nodes when the path length increases. With more
packet contention and subsequent packet loss, the card will automatically fall back to a lower transmission rate.
In our experiments, we notice that the auto-rate adaptation follows
a slow-start-like process. All nodes operate at the lowest data rate initially. We also
occasionally observe a surprisingly low video flow delivery rate
for a small number of flows in the auto-rate scenario.
This is because auto-rate does not
always succeed in adapting to a higher transmission rate when traffic is bursty.
However, once the card succeeds in adaptation, a close-to-optimal throughput
of about  can be achieved [2]. can be achieved [2].
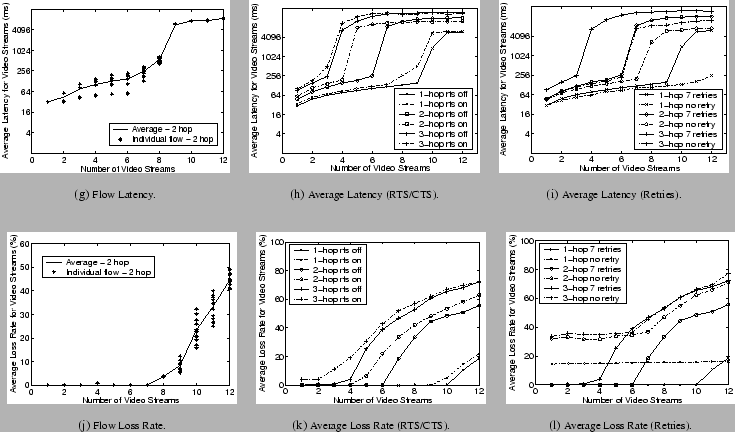
Figure 3:
Performance with increasing number of video streams.
 |
Figures 2(c) and (f) compares the performance obtained during the day
and at night for video flows traversing two hops with auto-rate.
Interestingly, although our test nodes operate on a different channel than the other
wireless networks in the building, we notice random interference and background
noise during the day that
significantly impacts the results.
Inter-flow Variation
Figures 3(a) and (d) show the fairness between competing
video traffic flows when the network is operated in auto-rate mode.
We notice that the latency variation among competing flows is significant when the network
is not saturated. Flows started a couple of seconds after the first flows
experience up to three times more latency
than earlier flows. When the network is congested,
the loss rate of the flows exhibits similar trends.
As the path length increases, the variation becomes more significant due to the inter-flow
contention between neighboring nodes.
The same patterns with voice data are also observed during our experiments.
These results indicate the phenomena of ``channel capture'' by earlier admitted flows
resulting in unfairness to later flows [7].
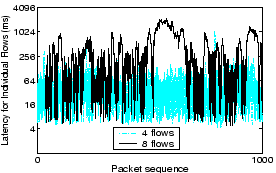
Intra-flow Variation
Figure 4 illustrates the per packet delay for
one individual flow on a 2-hop connection. The gray line indicates
the delay when the network is lightly loaded with four concurrent flows.
The delay variation is in the range of  to to  with an average of with an average of  .
The black line indicates the delay when the network is more heavily loaded
with eight concurrent flows. Hence there are more significant variations in the range
of .
The black line indicates the delay when the network is more heavily loaded
with eight concurrent flows. Hence there are more significant variations in the range
of  and and  with an average of with an average of  .
This indicates that with different channel conditions, traffic jitter could severely
impact the received video/voice quality. .
This indicates that with different channel conditions, traffic jitter could severely
impact the received video/voice quality.
Figure 4:
Intra-flow packet variation.
 |
Impact of RTS/CTS
RTS/CTS is recommended in the IEEE 802.11 standard to eliminate the hidden terminal problem.
The standard also suggests that for small packets RTS/CTS should not be
utilized because
of its extra overhead. For larger packets, RTS/CTS should be beneficial as a collision avoidance
mechanism. Figures 3(b) and (e) show the impact of RTS/CTS by comparing the performance
of video traffic with RTS/CTS enabled and disabled. The results indicate that even
with large video packets, RTS/CTS does not usually offer a performance improvement
in terms of reducing latency and loss. On the contrary, it may actually
limit the capacity of the network. For instance, Figures 3(b) and (e) show that
in the 2-hop scenario, only four flows achieve satisfactory quality when RTS/CTS is enabled,
while the network can support up to six flows when this feature is disabled.
Our results suggest that RTS/CTS should not be used for
multimedia traffic.
Impact of MAC Retransmissions
Figures 3(c) and (f) indicate the effect of changing the maximum
number of MAC layer
retransmissions on the delay and loss rate of the video traffic.
A small maximum retransmission value reduces the transmission latency
over each hop, as shown in Figure 3(c).
Such reduction subsequently increases the capacity of the network
if latency is the primary metric
in consideration. The introduction of MAC retransmissions also significantly improves the packet
delivery rate. As seen in the one hop scenario in Figure 3(f), the loss rate
when no retransmissions are enabled is constant, indicating possible background noise and interference.
When retransmission is enabled,
the loss rate significantly drops.
However, there is no one ideal value for the maximum number of retransmissions.
When the network becomes congested, the loss
rate with no retransmissions is actually no more than that with a maximum of
seven retransmissions. The
difference also varies with the number of hops.
Hence, investigation of the relationship between the
maximum number of retransmissions
and the number of hops of the path would help to find an optimal value
to achieve better performance.
Conclusions
In this paper, we have presented our experimental study of multimedia traffic delivery in
the UCSB MeshNet testbed.
We have evaluated the
performance of video and voice traffic through multi-hop wireless paths
and studied the network's capacity. We also examined the impact of different traffic and
network characteristics on the performance.
To summarize, we have made the following observations:
- The capacity of the network is constrained by the number of hops in the transmission path.
- The number of flows supported by the network is mostly heavily influenced
by the packet sending rate, not by the data rate or packet size.
- Auto-rate adaptation does not always lead to capacity improvement when bursty traffic
is present.
- Channel capture can result in unfairness among competing flows.
- Packet jitter variations can be significant in current 802.11b networks. Solutions
are needed to dampen the variation for real-time traffic delivery.
- RTS/CTS does not typically help in improving performance of real-time traffic.
- Finding an optimal value for the maximum retransmission number may help improve performance.
We believe our study is beneficial for both
wireless network capacity planning and protocol design. We have described our analysis methodology and utilities so that other researchers can
draw upon our experience for their own mesh testbed experiments.
We plan to continue our work studying experimental results obtained through our testbed.
Specifically, we
want to explore the techniques of reducing packet jitter in multimedia delivery
and apply
more advanced codec schemes and subjective evaluation methods to our traffic analysis.
This work is supported by an NSF Career Award grant (CNS-0347886), an NSF Networking
Research Testbeds (NRT) grant (ANI-0335302) and an NSF NeTS Award (CNS-0435527).
We would like to thank
Krishna Ramachandran for his effort in setting up the testbed and providing valuable input
on the network configurations.
- 1
-
Henning Schulzrinne at Columbia University.
RTP Tools (Version 1.18).
https://www.cs.columbia.edu/IRT/software/rtptools/.
- 2
-
J. Jun, P. Peddabachagari, and M. Sichitiu.
Theoretical Maximum Throughput of IEEE 802.11 and its Applications.
In Proceedings of the IEEE International Symposium on Network
Computing and Applications, pages 249-257, Cambridge, MA, April 2003.
- 3
-
C. Lin, H. Dong, U. Madhow, and A. Gersho.
Supporting real-time speech on wireless ad hoc networks: inter-packet
redundancy, path diversity, and multiple description coding.
In Proceedings of the ACM International Workshop on Wireless
Mobile Applications and Services on WLAN Hotspots (WMASH), pages 11-20, New
York, NY, 2004.
- 4
-
D. L. Mills.
Internet Time Synchronization: The Network Time Protocol.
In Global States and Time in Distributed Systems. IEEE
Computer Society Press, 1994.
- 5
-
K. Ramachandran, K. Almeroth, and E. Belding-Royer.
A Novel Framework for the Management of Large-scale Wireless Network
Testbeds.
In Proceedings of the  Workshop on Wireless Networks
Measurements (WinMee), Trentino, Italy, April 2005. Workshop on Wireless Networks
Measurements (WinMee), Trentino, Italy, April 2005.
- 6
-
IEEE Computer Society.
IEEE Standard for Wireless LAN-Medium Access Control and Physical
Layer Specification, November 1999.
- 7
-
N. Vaidya, P. Bahl, and S. Gupta.
Distributed Fair Scheduling in a Wireless LAN.
In Proceedings of the International Conference on Mobile
Computing and Networking (MobiCOM), Boston, MA, August 2000.
1
There is no
specific RTS/CTS threshold value indicated in the IEEE 802.11b standard.
Yuan Sun
suny@cs.ucsb.edu
|
