
Computer and network administrators are often confused or uncertain about the behavior of their networks. Traditional analysis using IP ports, addresses, and protocols are insufficient to understand modern computer networks. Here we describe NetADHICT, a tool for better understanding the behavior of network traffic. The key innovation of NetADHICT is that it can identify and present a hierarchical decomposition of traffic that is based upon the learned structure of both packet headers and payloads. In particular, it decomposes traffic without the use of protocol dissectors or other application-specific knowledge. Through an AJAX-based web interface, NetADHICT allows administrators to see the high-level structure of network traffic, monitor how traffic within that structure changes over time, and analyze the significance of those changes. NetADHICT allows administrators to observe global patterns of behavior and then focus on the specific packets associated with that behavior, acting as a bridge from higher level tools to the lower level ones. From experiments we believe that NetADHICT can assist in the identification of flash crowds, rapidly propagating worms, and P2P applications.
Network administrators are regularly confounded by the behavior of the networks they manage. Part of this confusion is a function of the rapid innovation in applications and protocols; it also arises from simple human unpredictability. Much of the blame for the mystery of computer networks, though, can be laid at the feet of our tools: we simply do not have the means for truly understanding what is happening in our networks [11].
To be sure, we have numerous tools for monitoring networks. Packet volume monitors can alert administrators to gross changes in network behavior. Flow reconstruction and protocol dissectors can reveal the behavior of individual connections. Signature scanners can identify specific security problems, and anomaly detectors can tell us that something is "different." As we discuss in the Related Work section, these tools, while useful, are not sufficient for us to achieve network awareness.
One key piece that is missing is a way to view traffic at the "right" level of abstraction. For example, when dealing with a surge in web traffic, we need more detail than "80% of your traffic is HTTP"; however, analyzing the patterns in 50,000 HTTP connections is sure to induce information overload. In order to address this shortcoming, we need tools that can automatically extract multiple human-comprehendable abstractions of network behavior (e.g., most of connections have slashdot in the HTTP referrer field). By understanding the structure of the observed abstractions and by seeing how future traffic fits into them, an administrator can quickly come to understand how network behavior changes at a level of granularity that facilitates both holistic understanding and appropriate response.
We have developed a tool called NetADHICT (pronounced "net- addict") for extracting and visualizing context-dependent abstractions of network behavior. NetADHICT hierarchically decomposes network traffic: for example, observed packets are first divided into IP and non-IP groups, IP packets are then split into TCP and non-TCP, and so on. What is notable about NetADHICT, though, is that its decomposition is automatically derived from observed traffic; in other words, it learns an appropriate context-dependent hierarchical classification scheme automatically with no built-in knowledge of packet or protocol structure.
NetADHICT is able to perform this feat through the use of a novel clustering method we refer to as "Approximate Divisive Hierarchical Clustering (ADHIC)." When applied to traces of captured traffic, NetADHICT generates hierarchical clusters that closely correspond to the kind of semantically meaningful abstractions that are normally used to describe network behavior [10]. Remarkably, NetADHICT often aggregates packets without the use of ports or IP addresses; it also groups packets across multiple flows when there is significant commonality.
Although we have not attempted to optimize NetADHICT, it is designed to be extremely efficient, allowing use of the tool at wire speed. We have benchmarked NetADHICT at 245 Mb/s. NetADHICT can achieve this speed because it classifies packets using sets of fixed-length strings located at fixed offsets within packets. We refer to these patterns as (p,n)- grams.
Of course, fancy algorithms are not enough to make a useful tool for observing networks; we also need appropriate interfaces for visualizing and interacting with observed traffic. To that end, this paper describes NetADHICT from the point of view of a network administrator. Specifically, we explain how NetADHICT's interactive AJAX-based web interface can be used to understand network behavior in a new, and we believe highly useful, way - one that gives insights into the sub-protocol behavior of networks in a way that preserves user privacy. Even though NetADHICT is still evolving, it has already proved to be a valuable tool for understanding networks. NetADHICT is made available under the GNU GPL license [13]; we hope that this paper will encourage others to get involved in the evolution of NetADHICT.
The rest of this paper proceeds as follows. The next section explains related work in tools and methods for understanding network traffic. We then give a detailed rationale for the use of hierarchical clustering to analyze networks and subsequently describe the ADHIC clustering algorithm. The interface and implementation of NetADHICT are described in the next section which is followed by a narrative on how one uses the tool in conjunction with other tools to allow administrators to better understand their networks. We then discuss limitations of NetADHICT and plans for future work before concluding by describing how to obtain our tool and a summary of our work.
Fundamentally, the problem of understanding network behavior is one of data reduction: we must transform gigabytes of network traffic into a small number of concepts and details that can be understood and acted upon by human administrators. As there are many different ways in which we can choose to understand network behavior, there is correspondingly a variety of tools that are designed to answer different questions.
Network and systems administrators have a variety of mature tools to select from for counting packets and flows. From open source solutions such as MRTG [16] and FlowScan [19] to large commercial offerings such as HP Openview [17] and IBM Tivoli [12], tools are readily available for visualizing the packet and flow statistics records that can be exported by many routers. Such solutions allow an administrator to determine bandwidth consumption on a host, network, or port basis. For well-behaved applications that use standard ports, such views can be useful for identifying deployed applications; as most peer- to-peer protocols and other multimedia protocols do not use standard ports or masquerade as HTTP (port 80) traffic, more sophisticated tools are needed to identify the most bandwidth-hungry applications.
The most common strategy for monitoring evasive applications at the network layer is to combine flow reconstruction with deep packet inspection and application-specific identification rules (signatures). Tools such as Wireshark (formerly Ethereal) [3] are designed to perform such analysis on captured packet traces. Commercial network forensics tools [4] facilitate ongoing traffic capture so that recent behavior can be queried on demand to provide packet, flow, application, and even user-level views of traffic. In contrast, other commercial products such as those produced by Sandvine [22] can analyze packets at wire speeds, primarily to enable per-application traffic shaping. What these systems have in common is that they rely upon elaborate sets of rules in order to identify, dissect, and even change application behavior. While such rules are generally crafted by hand, there has been extensive research in identifying applications and usage patterns using a variety of machine learning techniques [2, 14, 6].
Network administrators, however, are interested in more than monitoring what applications are running; they also need to know when human intruders or malware have compromised the security of their systems. Intrusion detection systems are most commonly built upon elaborate rule databases that specify the signatures associated with known attacks [21] or specifications of what network activity is and is not allowed [18]. One fundamental problem for all such systems, though, is that disruptive network activity often is caused not by attackers but by highly popular legitimate applications or services (e.g., flash crowds). Either the rules have to be broad enough to not signal alarms in some disruptive conditions, or administrators have to tolerate a regular stream of false alarms.
Anomaly detection systems have the potential to adjust rules to local conditions through the use of machine learning mechanisms; behavior at the network layer, however, is highly dynamic, and in fact attempted attacks are now routine on the Internet. For these reasons, some researchers are coming to believe that anomaly detection at the network layer is a questionable strategy for detecting security incidents [9]; such reasoning, however, does not exclude the use of anomaly detection for detecting networking problems in general [1].
While these various techniques for monitoring and classifying network behavior have their place, there is also a need for tools that can uncover other aspects of the structure of network traffic. The next section explores what is missing in currently available tools.
To understand network behavior we need to observe more than changes in packet volume or security status. In addition, we need to discern patterns in traffic that allow us to group related communication activities together. While we cannot hope to find all possible patterns, there are a number of ways to capture simple patterns in network traffic. The general strategy for grouping packets together using automatically learned patterns (or features) is to employ a clustering-based machine learning algorithm.
One strategy for clustering packets is to learn patterns associated with sets of flows. For example, AutoFocus [7] is a system that hierarchically clusters packets using IP address and port information so that temporal patterns in the activities of groups of hosts can be inferred. However, there are many interesting patterns which cannot be defined in terms of protocol and address. Ma, et al. [14] addressed this limitation by building classifiers from network flows using the header and first 64 bytes of payload from the initial packet in each flow. Their classifiers were built using clusterers. Clusterers don't label data, they simply group it together. Once a clusterer was constructed, the packets in each cluster were examined and assigned to a particular protocol, turning the clusterer into a classifier. Although, Ma's approach is promising, it is not fast enough to be used to monitor networks online. In fact, most general clustering and classification algorithms are simply too slow to learn at wire speed. This limitation is significant because we want to observe changes in behavior as they happen so that we may react to changes in a timely fashion.
NetADHICT differentiates itself from other traffic clustering tools in that NetADHICT clusters traffic without knowing in advance any details about the packets' structure and does so in a way that can execute at the speed of the network. This allows it to find its own differences between the packets - differences that adapt automatically to the traffic as it changes. Traffic volume patterns can be watched online and compared between the differentiated clusters. These traffic groups are presented visually through a tree: Packets that are found to be internally dissimilar are clustered separately, so that users immediately observe that they are different in nature. Also, each cluster's position in the tree contains a wealth of context about how the traffic for that cluster is similar and different from the rest of the network's traffic. Volume of traffic through each cluster is displayed in the tree in near real-time, allowing administrators to analyze traffic patterns as they emerge.
High level tools can often show that something is wrong. Low level tools give tremendous detail, but often are too slow or too information-rich to be used Clustering is a form of filtering that allows one to focus on relevant behavior. NetADHICT allows the integration of high and low level tools while providing enough information to allow administrators to move smoothly from high to low.
The NetADHICT interface is designed to facilitate such multi-level exploration. It is built around the cluster tree approach to network volume visualization. Each cluster of traffic within the tree is identified by a traditional classifier and colored appropriately. (The traditional classifier is built around EtherType, IP protocol, and IP port.) This coloring of the clusters, along with their position in the tree, highlights traffic that is contextually different but using the same ports. It provides an excellent starting point for delving further into different classes of traffic in the network and highlights classes that would have remained completely hidden otherwise. In this fashion NetADHICT is a tool for enhancing network awareness.
NetADHICT is centered around a novel clustering algorithm that recursively splits the set of observed packets into smaller and smaller groups. We call our algorithm Approximate Divisive HIerarchical Clustering (ADHIC), the root of NETwork ADHIC Tool (NetADHICT). This algorithm is classified as a type of machine learning algorithm broadly known as divisive hierarchical clustering [5], but ours is substantially different than other general purpose or network specific clustering algorithms. We give an overview of ADHIC below; for more details, please see Hijazi [10].
The feature we use to split groups of packets is called a (p,n)-gram. (p,n)-grams are used to denote substrings at fixed offsets within packets. The p is the offset and n is the length of the substring. For example, the (p,n)-gram (8, 0xdc3b) denotes the 2 byte hexadecimal substring 0xdc3b 8 bytes into the packet (these are the middle bytes of the source MAC address in the Ethernet frame).
Divisive hierarchical clusterers form decision trees. The tree is constructed using the split and merge operations. When the average bandwidth of a terminal cluster (leaf) exceeds a configurable threshold over a certain time window, the cluster is split into two clusters. The existing node becomes an internal decision node and two new terminal clusters are formed. A (p,n)-gram is found by examining the packet cache, a buffer that stores a few percent of recently received packets. (p,n)-gram frequencies are calculated for packets assigned to the terminal cluster in question, and a (p,n)-gram is chosen which matches roughly half of them. Conversely, if a node averages less than a set bandwidth limit, it is deleted and its parent becomes a leaf node. Newly created nodes cannot be merged for a certain number of minutes, called the maturation period, to prevent transient behavior from affecting tree structure.
Through these two operators, ADHIC generates a decision tree that specifies the contents of clusters. The path from the root of the tree to a leaf or other internal cluster specifies the boolean equation of (p,n)-grams which determine if a packet belongs to that cluster.
Consider, for example, the tree in Figure 1. The root node has a (p,n)-gram of (1, 0x0393) and its child (p,n)-grams (9 0x70ad) and (0, 0x0100). All the offsets point to locations within the MAC addresses of the Ethernet frame. The offsets 0 and 1 segregate portions of the destination MAC address and 9 distinguishes between source MAC addresses. The left edge signifies that the packet has matched the (p,n)-gram in the parent node. The right edge is followed for packets that do not contain that (p,n)-gram. Please note the labeling of the nodes and the pie charts is not a part of the ADHIC algorithm; it is a visualization produced by NetADHICT and is explained in the "NetADHICT" section.
The decision trees produced by the ADHIC algorithm have a number of strengths as representations of network structure. They are simple in structure and semantics, facilitating user understanding and analysis. Trees can be frozen, or subtrees removed from the learning algorithm, allowing users to directly modify the tree. Subtrees can be incrementally modified and augmented by users in a straightforward way. Additional information and statistics may be easily added to decision trees. Finally, the ADHIC representation also easily lends itself to implementations like the decision tree packet classification algorithms often used as alternatives to TCAM [23].
NetADHICT's user interface is an interactive AJAX-based web page (Figure 2). The primary element of this interface is the tree view, which allows the network administrator to quickly see how traffic is being distributed between clusters and what traffic each cluster represents. The tree view can update itself with newly available data as it becomes available, allowing network administrators to watch changes in the traffic's structure as they occur.
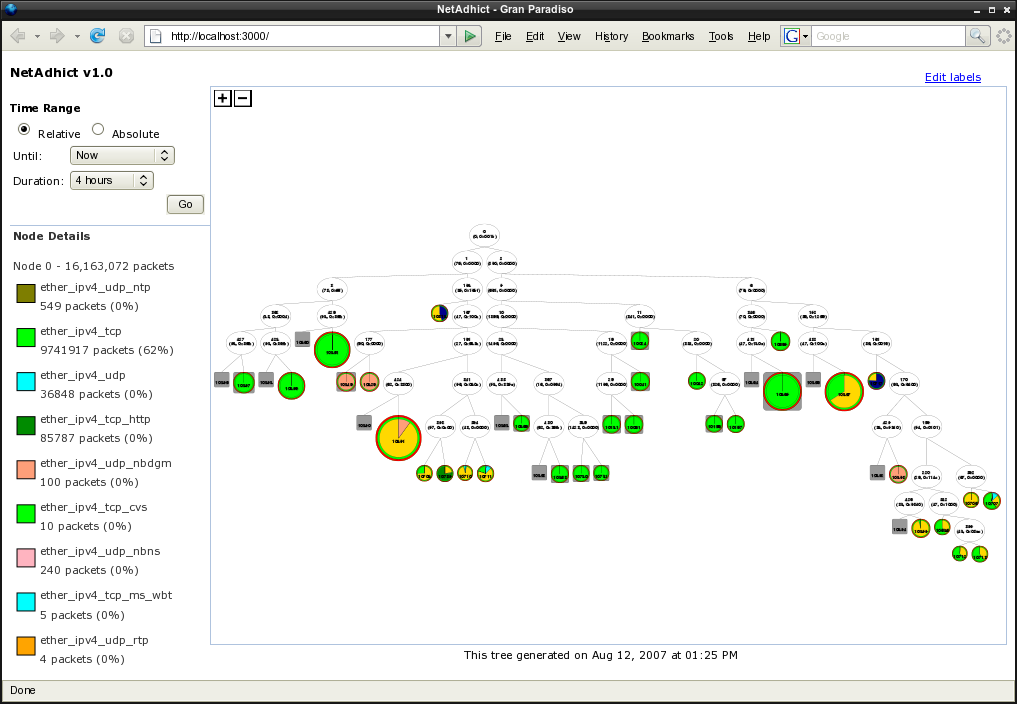
Traffic is shown in the tree view for a selected time period, as shown in Figure 3. The time period is normally selected relative to the present time; it can be set to always show the latest data available or just data that was available in the past. Alternatively, a time period can be specified directly for any time at which there is traffic data available.
In the tree view, internal nodes represent a (p,n)- gram operation which is displayed within each node, such as (6, 0x0001). By tracing a node's ancestors up the tree, you can see which (p,n)-grams are or are not present in the node's traffic.
Terminal clusters show traffic volumes for the selected time period, as well as much more information through their size and coloring. The size of each terminal cluster represents the volume of traffic relative to all other terminal clusters in the tree. The sizes make it easy to see where traffic is distributed within the tree from a high level, or within a subtree at a lower level.
The coloring of each terminal cluster represents the basic packet types of its traffic and the traffic's labels. Basic packet types include IP, TCP, UDP, and other non-IP traffic. For each cluster, the outer ring's color shows what percentage of traffic for that cluster, for the specified time period, consisted of IP packets. For IP traffic, an inner ring shows what percentage of the traffic was TCP, UDP, or other IP packets. In Figure 4, TCP traffic dominated but approximately 6% of the traffic assigned to the cluster was UDP packets and another 5% was non-IP packets (ARP in this case).
Labels are used to name and group the semantic classes of traffic for a cluster. NetADHICT provides initial labels and colors with a simple traffic classification by EtherType, IP protocol, and IP port, but a user-defined label can be applied to each classification when a more precise semantic class is determined by the network administrator. The labels for each terminal cluster are represented through the pie charts within the rings. Each color represents a different label and their size represents the percentage of traffic for that cluster which belonged to the given label.
Labels are created, modified, and deleted by the network administrator within the NetADHICT interface. By clicking on the "Edit labels" link in the top right corner, the label editing interface (Figure 5) is displayed. From here the system administrator can create new labels, remove old ones, or change the names and colors of existing labels.
Detailed information for any node in the tree, internal nodes and terminal clusters alike, can be displayed by hovering the mouse over the node (Figure 5). The details include the precise volumes of traffic which the node and all nodes below it represent. They also show what traffic classification or label each color in the node's pie chart represents, what percentage of the node's traffic fell into each label, and let you change the labels for the node's traffic.
For more detailed analysis, the traffic represented by any cluster can be exported by NetADHICT into packet dump files. These dumps can then be analyzed using standard network analysis tools such as Wireshark. Any number of clusters can be selected for a packet capture by shift-clicking on them. While selected for capturing, all packets that match the clusters will be captured to pcap files; these files can be downloaded at any time during the capture.
The NetADHICT backend packet analyzer and frontend web interface both require access to a MySQL database. The frontend is a Ruby on Rails application and so requires a web server configured with support for such applications. A web browser is used to view the NetADHICT interface.
NetADHICT's trees are rendered using standard SVG and JavaScript; however, because many current browsers have poor support for JavaScript-generated SVG, the quality of NetADHICT's interface varies greatly depending upon the web browser used. In fact, at the time of this writing the Firefox 3 alpha release (also known as Gran Paradiso [8]) is the only truly capable browser for running NetADHICT. Firefox 2 is functional but too slow for real use. Internet Explorer 7 and Konqueror 3 lack the SVG support required, and the latest Opera release (version 9.23) contains critical bugs in regard to its SVG support that prevent NetADHICT from functioning. While this variable performance is currently problematic, better SVG support is on the short-term development roadmap for most browsers; thus, we believe the browser compatibility issue will soon cease to be a significant problem for NetADHICT.
We now move from describing the tool itself to how a network administrator would use the tool in several common situations. These situations are:
In earlier papers [10, 15], we described several experiments which we used to evaluate the ADHIC algorithm. The following descriptions are not of actual experiments, but we draw upon our research experience to describe how one could use the tool in a small network context. While we believe these usage scenarios should generalize to larger networks, further testing is required.
The first usage scenario is network surveillance under normal conditions. The network administrator begins a session by examining the current tree, as in Figure 2. An administrator knows what a normal-condition tree and flow values (the size of the pie charts) look like and can immediately spot anomalous behavior. If he sees unusual behavior in some part of the tree he can magnify the subtree and examine its volume pie charts to see what is wrong.
Alternatively, he can view the tree for specific past time periods. By viewing the series of trees from the immediate past he can see how the tree developed to its current form. We have found this "movie" to be very useful in understanding network behavior. It is analogous to animated radar maps - but instead it shows network weather.
As we will discuss in the other usage scenarios, anomalous traffic flows will lead to easily identifiable changes in the tree structure or the volume pie charts. However, if the tree visualization is not enough to identify the problem he can hover the cursor over a node to see the statistical network traffic volume summary as in Figure 6.
An administrator has another option if he needs more information than the two visualizations provide. He can shift-click on any number of clusters to request that NetADHICT record all future packets assigned to those clusters. These packets can then be downloaded as a pcap file into a tool like WireShark [3]. This allows the administrator to use any analysis tool he likes that reads pcap files while first using NetADHICT to eliminate the vast majority of uninteresting traffic.
Now let us consider what might happen if a particular page on a website was hit by a flash crowd, or "slashdotted." A traditional network tool would notify the administrator that total traffic volume is up, when the surge occurred, and would probably identify, using port numbers, that HTTP is the culprit. The administrator might then turn to the web server logs for further information.
Like a traditional tool, NetADHICT would show that traffic is up, that it is HTTP, and when the surge in traffic started and if and when it ended. NetADHICT's other behavior would differ based on how long the flash crowd remains. If it is much shorter than the maturation period, then the flash crowd would be contained in the terminal nodes. These would likely be dominated by HTTP and the administrator would have to refer to the web server's logs for more information. If the flash crowd remained longer than the maturation period, though, NetADHICT would begin segregating traffic, searching for commonalities in the packets of the flash crowd.
If the flash crowd were from a particular network with a common prefix, NetADHICT might recognize it by specifying the address in the created (p,n)-grams. Or, it might find (p,n)-grams that matched other parts of the header or even payload contents such as the requested URL. The key thing to remember is that NetADHICT will keep refining its classification of incoming packets so long as certain nodes continue to receive more than their "fair share" of packets, and so long as there exists (p,n)-grams that match a significant fraction of a high traffic node's packets.
The resulting cluster equations (encoded in the structure of the tree) would give the administrator more information than the traditional tools before he dove into the web logs. Further, because NetADHICT can provide exemplars of the "new" packets, a network administrator would have a significant head start in determining the precise characteristics and origin of the flash crowd.
Peer-to-peer (P2P) traffic is in some ways similar to flash crowds. The differences lie in that many P2P protocols are not well documented and many actively try to evade traditional traffic classification. For example, many BitTorrent clients now provide the option to encrypt their data so that payload inspection cannot identify the protocol [20]. In addition to encrypting its payload, BitTorrent does not use standard ports. Because of this, traditional tools often either cannot classify or mis-classify P2P traffic that use these evasion tactics.
NetADHICT does not need to know about protocol structure, so it can be more useful than traditional tools in such situations. In our evaluation experiments [10] we found that ADHIC, when confronted with (unencrypted) BitTorrent as a new protocol, segregated the traffic into just two terminal clusters. These clusters corresponded to the UDP tracker packets and the TCP content packets. Thus, we believe that a network administrator, when investigating a new high network volume application, would see one or a few nodes with increased traffic. If the P2P session lasted several maturation periods, NetADHICT would begin splitting those nodes, building a P2P dominated subtree. Other than the port-based color labeling, NetADHICT cannot classify traffic, but it could provide a pcap file of P2P traffic with all other traffic filtered out for the administrator to investigate.
NetADHICT application-level classifications are more robust than those produced by traditional port-classifying tools. For example, suppose that a P2P client uses port 80 for its traffic. Traditional tools would likely mis- classify the new application traffic as HTTP. In experiments we have found that NetADHICT, because it often ignores ports, continues to cluster P2P traffic correctly even when clients use misleading ports [10].
Finally, let us consider the case of a propagating worm. Worms are a subcase of the flash crowd because they involve a large increase in traffic over protocols that are already used. The benefits of NetADHICT are similar to those during a "slashdotting." If a particular set of addresses is responsible, NetADHICT may allow the administrator to discover it by knowing the (p,n)-gram offsets. Similarly, NetADHICT might also create new clusters specific to worm traffic. Inspection of the (p,n)-gram equation might allow the administrator to construct a signature for the worm, which could then be applied to a firewall or an intrusion prevention system. Even if the (p,n)-gram equations could not be used for this purpose, the pcap file NetADHICT provides would be useful in signature construction.
We believe NetADHICT would be useful in many additional scenarios. These, however, hopefully provide a useful introduction in how the tool could be used. NetADHICT, as a complement to existing tools and systems, can allow an administrator to quickly ascertain the state of his network and investigate any anomalous behavior as it occurs.
While our experience with NetADHICT has convinced us that it is a useful tool for network administrators, we have also experienced its limitations. First and foremost is ADHIC's inability to classify packets. ADHIC is a clustering algorithm that does not rely on prior knowledge to segregate traffic into clusters - therefore the clusters may not always have the semantic splits that administrators may prefer. ADHIC's use of (p,n)-grams also is a source of problems. Some interesting semantic splits do not lend themselves to using (p,n)-grams. The reason for this is that some identifiers are not at constant offsets from the beginning of the packet. These weaknesses are mitigated by NetADHICT's incorporation of a traditional classifier, its ability to work with other network analysis tools using pcap files, and the administrator's ability to label the cluster tree.
The extent to which these inherent limitations will affect NetADHICT's usefulness is not clear. To this point we have not investigated NetADHICT's behavior beyond our own laboratory's network. We have determined that NetADHICT can often segregate encrypted and multimedia traffic, by only using their packet headers. If traffic moves to more evasive strategies such as overloading common protocol ports, playing with the other header fields, and using encrypted payloads, NetADHICT may be less able to discover patterns in network traffic.
Evaluation of NetADHICT is difficult because it uses full packet payloads. Using full payloads introduces privacy concerns. This has not been an issue for our internal lab, but we could not investigate NetADHICT's behavior on other, larger, networks because of our inability to correlate the generated trees with the raw pcap traces.
Our limited ability to evaluate NetADHICT has helped motivate us to release this tool. We can advance our research and improve it with more administrators testing NetADHICT on their own networks.
The tool continues to improve, even without an external user base. We are improving the integrated traditional classifier. In addition, we would like to give users the ability to control the tree through manipulating or locking nodes as it grows. This may improve an administrator's ability to find, label, and track semantic classes of traffic. We are also investigating different user interfaces and visualizations of the data.
Finally, we are working on moving the cluster and sampling portions of NetADHICT into the Linux kernel. This would greatly improve efficiency and increase throughput. Also, the kernel implementation allows us to schedule or filter at a per cluster level, allowing us to use NetADHICT to actively manage network traffic to improve resource allocation and mitigate malicious activity [15]. We see such extensions as a fruitful area for future research.
NetADHICT is licensed under the GNU General Public Licence (GPL), version 2 or greater. It is available for download at the CCSL software website at https://www.ccsl.carleton.ca/software.
NetADHICT shows great promise in aiding administrators in understanding network behavior. It provides a new way to separate traffic that is normal from "interesting" traffic that an administrator is interested in analyzing. With new ways to visualize traffic and providing a network "weather" map, NetADHICT allows administrators to see the status of their whole network at a glance, while also providing ways to investigate smaller flows of traffic. While development and testing are ongoing, by acting as a bridge from higher level analysis tools to low level ones, NetADHICT has the potential to improve how administrators manage network resources.
This work was supported by the Discovery grant program of Canada's National Sciences and Engineering Research Council (NSERC) and MITACS.
Hajime Inoue is a Principal Scientist at ATC-NY in Ithaca, NY. He was
previously a Postdoctoral Fellow at the Carleton Computer Security Laboratory.
He recieved a B.S. in biophysics from the University of Michigan in 1997 and a
Ph.D. in Computer Science from the University of New Mexico in 2005. He can be
reached at  .
.
Dana Jansens is currently studying towards a B.C.S. at Carleton University
specializing in networks and operating systems and works as a research
assistant in the Carleton Computer Security Lab. In her spare time, she leads
the Openbox window manager project and studies social justice issues. You can
reach her at  .
.
Abdulrahman Hijazi graduated with his masters degree in CS at Johns
Hopkins University in 2003 with highest honors. He previously had seven years
of work experience as a system analyst/programmer. He is currently pursuing
his Ph.D. in computer science at Carleton University. You can reach him at
 .
.
Anil Somayji is an assistant professor in the School of Computer Science
at Carleton University and is associate director of the Carleton Computer
Security Laboratory. His research interests include computer security,
operating systems, complex adaptive systems, and artificial life. He received
a B.S. in Mathematics from the Massachusetts Institute of Technology in 1994
and a Ph.D. in Computer Science from the University of New Mexico in 2002. He
can be reached at  .
.