|
||||||||||||||
|
|||||||||||||||||||||||||||||||||||||||||||||||||||||||||||||||||||||||||||||||||||||||||||||||||||||||||||||||||||||||||||||||||||||||||||||||||||||||||||||||||||||||||||||||||||||||||||||||||||||||||||||||||||||||||||||||||||||||||||||||||||||||||||||||||||||||||||||||||||||||||||||||||||||||||||||||||||||||||||||||||||||||||||||||||||||||||||||||||||||||||||||||||||||||||||||||||||||||||||||||||||||||||||||||||||||||||||||||||||||||||||||||||||||||||||||||||||||||||||||||||||||||||||||||||||||||||||||||||||||||||||||||||||||||||||||||||||||||||||||||||||||||||||||||||||||||||||||||||||||||||||||||||||||||
| initialize |
| For each URL |
|
|
|
|
|
|
|
One source of web traffic not captured by the above measurement experiments is embedded web content, which includes media files delivered by dedicated media servers secondary to a web server, private CDNs, or third-party on-line advertisement objects (e.g., doubleclick.com). To uncover such web traffic, we crawled the above keyword-retrieved URLs individually, and extracted from the crawled pages URLs associated with embedded objects. Combining keyword-retrieved URLs with embedded-object URLs increased the total number of our collected URLs by a factor of three.
Next we extracted a web server IP address from each URL
and mapped it to its corresponding AS. A number
of issues complicated this seemingly straightforward step.
For one, some frequently-accessed web sites employ
DNS-based load balancing, whereby their domain names are
resolved to multiple addresses in a round-robin manner.
In more sophisticated cases, a given domain name is resolved to
a set of addresses depending on the querying client's
geographic location, web server availability, and network condition.
CNN and AOL are examples of two content providers employing such
DNS-based web request routing, and their domain names are
typically resolved to hundreds of addresses spread out geographically
and administratively over the Internet.
To obtain all IP addresses associated with a given web server's
domain name, we performed a reverse-DNS lookup of each domain name
from 96 geographically dispersed PlanetLab
nodes (planet-lab.org), and collected all resulting addresses.
Using BGP routing tables, we then mapped
each resulting IP address to its corresponding AS.
In Table 2, we summarize the steps taken to obtain
the web-hosting utility ![]() for every AS
for every AS ![]() ,
where
,
where ![]() can be viewed as an estimate of
the byte counts of popular web content hosted by AS
can be viewed as an estimate of
the byte counts of popular web content hosted by AS ![]() .
.
| ARIN | RIPE | APNIC | ||||
|
|
AS# | Name | AS# | Name | AS# | Name |
| 1 | 3561 | Savvis | 8560 | Schlund | 3786 | Dacom |
| 2 | 2914 | Verio | 8220 | Colt | 4766 | Korea Telecom |
| 3 | 16509 | Amazon | 16276 | Ovh | 9304 | Hutchison |
| 4 | 21844 | ThePlanet | 3320 | Deutsche Telekom | 9318 | Hanaro Telecom |
| 5 | 11643 | eBay | 559 | SWITCH | 4808 | Chinanet |
| 6 | 13749 | Everyones Internet | 680 | DFN | 4134 | China Telecom |
| 7 | 7018 | AT&T WorldNet | 1273 | C&W | 2514 | NTT |
| 8 | 209 | Qwest | 702 | MCI Europe | 9848 | GNG |
| 9 | 701 | UUNet | 12312 | Tiscali | 4812 | China Telecom |
| 10 | 14134 | Navisite | 12322 | Proxad | 23880 | Yahoo-KR |
Finally, we sort the ASs by their utility
![]() in decreasing
order and assign them ranks, denoted
in decreasing
order and assign them ranks, denoted
![]() .
Table 3 lists the top-10 Web hosting ASs by rank,
in three different geographic regions: North America (ARIN), Europe
(RIPE) and Asia-Pacific (APNIC). As expected, the top-ranking Web hosting ASs
include e-commerce companies (e.g., Amazon and eBay), telecom companies
(e.g., AT&T, Deutsche Telekom, Korea Telecom), and well-known portal
sites (e.g., Yahoo). One notable observation is the dominance of
telecom companies in the Web hosting business in the Asia-Pacific region.
.
Table 3 lists the top-10 Web hosting ASs by rank,
in three different geographic regions: North America (ARIN), Europe
(RIPE) and Asia-Pacific (APNIC). As expected, the top-ranking Web hosting ASs
include e-commerce companies (e.g., Amazon and eBay), telecom companies
(e.g., AT&T, Deutsche Telekom, Korea Telecom), and well-known portal
sites (e.g., Yahoo). One notable observation is the dominance of
telecom companies in the Web hosting business in the Asia-Pacific region.
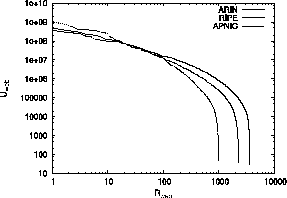
Fig. 1 shows the entire ![]() vs.
vs. ![]() distribution. Consistent with previous
findings [6,22,9],
distribution. Consistent with previous
findings [6,22,9],
![]() associated with high-ranking ASs (e.g., up to rank
associated with high-ranking ASs (e.g., up to rank ![]() ) in all three
geographic regions are characterized by a Zipf-type law (i.e.,
) in all three
geographic regions are characterized by a Zipf-type law (i.e.,
![]() , where
, where
![]() for ARIN and RIPE, and
for ARIN and RIPE, and
![]() for APNIC). The steep fall-off of the curves in
the region of low-ranking ASs is likely due to the limited coverage
our keyword-based crawling process has of their web content.
for APNIC). The steep fall-off of the curves in
the region of low-ranking ASs is likely due to the limited coverage
our keyword-based crawling process has of their web content.
The key underlying assumption in our empirical method is that to infer the popularity of content networks, a feasible alternative to using actual web traffic measurement is to rely on data that measures the appearance of web content in search results. Strictly speaking, this alternative method can only account for traffic from users actively seeking specific information, not traffic from users visiting bookmarked pages or links on web pages. However, due to our decision to use the top 10,000 most popular keywords, we expect the resulting bias to be small. It is well-known that Google's PageRank weighting algorithm carefully considers web link structures (e.g., links that a page receives) in calculating link values. As a result, we believe that our method does implicitly account for some aspects of actual link traffic.
Ideally, characterizing web service utility should make use of measured inter-domain web traffic, as is done for example by Feldman et al. [9]. However, this requires access to server logs of widely-deployed private CDNs. Such data is not publicly available. These data sets are also limited in their coverage: they capture only web content served by the CDN, and they do not capture web traffic emanating from content providers who are not clients of the CDNs. These difficulties illustrate the technical challenges associated with accurate estimation of inter-domain web traffic. Viewing our method as one of many viable approaches to making progress in this area, it exemplifies how a combination of publicly obtainable and publicly available data sets can be used to infer inter-domain traffic volume. At the same time, the method is flexible enough to incorporate web server logs from CDNs should such logs become publicly available.
To infer an AS's utility in providing residential Internet access, we estimate it by the number of P2P file sharing users of the AS. Besides web browsing, P2P file-sharing is currently one of the most popular applications on the Internet (cachelogic.com). To estimate the number of users per AS, we perform measurement experiments involving three different file sharing systems: BitTorrent (bittorrent.com), eDonkey (edonkey2000.com), and Gnutella (gnutella.com). At the time of our study, these were among the most popular file sharing systems in use on the Internet [4].Since traffic on the FastTrack/KaZaA network has declined sharply in the past few years and continues to decline, we did not include it in our study.
Most P2P file sharing systems have built-in mechanisms to discover existing users, which makes estimation of file sharing population relatively straight forward. The Gnutella system employs a decentralized approach to file searching: individual Gnutella peers form an overlay network to propagate search messages. The eDonkey systems, on the other hand, relies on dedicated, centralized servers which peers must contact to search for a file. Similarly, BitTorrent relies on centralized Trackers from which a peer can obtain a list of other peers serving a particular file.
To estimate the population of BitTorrent, we downloaded about 2,800 torrent files from a well-known BitTorrent web site (torrentspy.com). A torrent file contains the meta data of a shared file, among which is the address of the BitTorrent tracker cognizant of peers sharing the file. Using BTtools (bagley.org/~doug/project/bttools), we obtained from each tracker a list of peers in possession of complete copies of the file (seeds in BitTorrent parlance). Over a period of four days, we collected about 634,000 distinct IP addresses of BitTorrent peers.
To estimate the population of eDonkey, we ran a toy eDonkey server and recorded the IP addresses of all the peers that contacted our server. eDonkey servers run a gossip protocol among themselves to maintain an up-to-date list of the server population. Each eDonkey peer maintains a list of servers and sends them periodic ping messages. In one day, our eDonkey server collected about 1,014,000 distinct IP addresses of eDonkey peers from these ping messages.
Finally, for the purpose of estimating the population of Gnutella, we ran a Gnutella client application on 20 PlanetLab nodes (10 in North America, 5 in Asia-Pacific, and 5 in Europe) and recorded the IP addresses of all Gnutella peers which exchanged traffic with us. Over a period of one week, we collected about 542,000 distinct IP addresses of Gnutella peers.
| ARIN | RIPE | APNIC | ||||
|
|
AS# | Name | AS# | Name | AS# | Name |
| 1 | 1668 | AOL | 3320 | Deutsche Telekom | 4134 | China Telecom |
| 2 | 7132 | SBC | 3352 | Telefonica España | 4837 | China Network |
| 3 | 6478 | AT&T WorldNet | 3215 | France Telecom | 3462 | HiNet |
| 4 | 22909 | Comcast Cable | 12322 | Proxad | 4788 | TMnet |
| 5 | 577 | Bell Canada | 5617 | Polish Telecom | 1221 | Telstra |
| 6 | 22773 | Cox | 3269 | Telecom Italia | 4804 | Microplex |
| 7 | 812 | Rogers Cable | 5089 | NTL | 10091 | SCV |
| 8 | 7843 | Adelphia | 2856 | BTnet | 4812 | Chinanet |
| 9 | 6327 | Shaw | 6739 | Cableuropa | 9506 | Magix |
| 10 | 6128 | Cablevision | 3209 | Arcor | 7545 | TPG |
In total, we collected about 2.19 million distinct P2P IP addresses,
which we subsequently mapped to their corresponding AS using BGP
routing tables. Denoting by ![]() the utility of AS
the utility of AS ![]() as a residential Internet access provider, we computed this
quantity for every AS
as a residential Internet access provider, we computed this
quantity for every AS ![]() by counting the number of distinct P2P
IP addresses associated with AS
by counting the number of distinct P2P
IP addresses associated with AS ![]() .
Of course, some P2P users perform more active downloads/uploads
than others. By aggregating a sufficient number of IP addresses,
we try to minimize any error that may be caused by ignoring such
fine-grained file sharing activity.
We sort ASs by their utility
.
Of course, some P2P users perform more active downloads/uploads
than others. By aggregating a sufficient number of IP addresses,
we try to minimize any error that may be caused by ignoring such
fine-grained file sharing activity.
We sort ASs by their utility ![]() in decreasing order
and assign them ranks, denoted
in decreasing order
and assign them ranks, denoted ![]() .
Table 4 lists the top-10
residential access ASs by region. In the European and Asia-Pacific
regions, most of the high-ranking residential access providers are
associated with telecom companies. In the North American region, retail
Internet access business is more diversely distributed among
telecom carriers and cable companies.
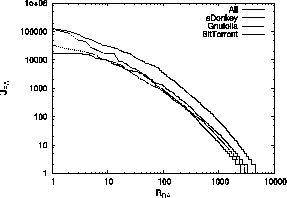
Fig. 2 shows the entire
.
Table 4 lists the top-10
residential access ASs by region. In the European and Asia-Pacific
regions, most of the high-ranking residential access providers are
associated with telecom companies. In the North American region, retail
Internet access business is more diversely distributed among
telecom carriers and cable companies.
Fig. 2 shows the entire ![]() vs.
vs. ![]() distribution,
for all three P2P file-sharing applications individually as well as
for their aggregate. In agreement with a recent study based on
proprietary data set [20],
distribution,
for all three P2P file-sharing applications individually as well as
for their aggregate. In agreement with a recent study based on
proprietary data set [20],
![]() associated with the top 100 or so highest-ranking
ASs can be characterized as a Zipf-type law with parameter -0.9.
associated with the top 100 or so highest-ranking
ASs can be characterized as a Zipf-type law with parameter -0.9.
One caveat in measuring P2P network usage is that the user base of different P2P systems is not uniformly distributed across residential networks [19]. Since several P2P applications with distinct features and evolving popularity coexist, relying on a single application may introduce sampling bias in capturing residential population. Our use of three popular file-sharing systems provides a reasonable coverage of the current file-sharing population. Our utility measurements can also be extended to not only cover other emerging P2P systems as they become popular, but also to include proprietary data such as per-AS statistics on residential subscriptions (including the amount of traffic generated by its connected residential customers), should the latter become publicly available.
Our approach to infer an AS's utility in providing business access
relies on publicly available BGP routing tables to estimate
the AS's bandwidth distribution.
From a BGP routing table, one can infer provider-customer relationship
among different ASs [10],
and a naive estimate of an AS's bandwidth distribution would
be the number of its customer ASs.
However, this lump-sum measure does not distinguish between
customer ASs of different sizes.
A more meaningful measure of an AS's bandwidth
distribution is the number of downstream ASs
that are reachable from the AS, following the provider-customer
relationship chains. A large transit customer AS with
a high bandwidth requirement will then be properly weighted by
its number of downstream customers.
If a customer AS is multi-homed, i.e., obtaining its Internet access
from several providers, it
would typically impose lower bandwidth requirements on each provider
than if it were single-homed.
To infer ![]() , the utility of AS
, the utility of AS ![]() of providing business access,
we assume that every AS has a unit bandwidth requirement.
We then percolate each AS's bandwidth requirement up the
provider-customer relationship hierarchy. When an AS is multi-homed,
its per-provider bandwidth requirement gets divided by the number
of its providers. We estimate
of providing business access,
we assume that every AS has a unit bandwidth requirement.
We then percolate each AS's bandwidth requirement up the
provider-customer relationship hierarchy. When an AS is multi-homed,
its per-provider bandwidth requirement gets divided by the number
of its providers. We estimate ![]() in terms of the
bandwidth distribution of AS
in terms of the
bandwidth distribution of AS ![]() , computed as shown in Table 5.
, computed as shown in Table 5.
| for every AS |
|
| while (1) |
|
|
|
|
|
| ARIN | RIPE | APNIC | ||||
|
|
AS# | Name | AS# | Name | AS# | Name |
| 1 | 701 | UUNet | 1299 | TeliaNet | 4637 | Reach |
| 2 | 1239 | SprintLink | 702 | MCI Europe | 10026 | ANC |
| 3 | 3356 | Level3 | 3320 | Deutsche Telekom | 2516 | KDDI |
| 4 | 7018 | AT&T WorldNet | 8220 | Colt | 3786 | Dacom |
| 5 | 209 | Qwest | 5511 | France Telecom | 703 | UUNet AP |
| 6 | 2914 | Verio | 1273 | C&W | 4766 | Korea Telecom |
| 7 | 3549 | Global Crossing | 6762 | Telecom Italia | 7474 | Optus |
| 8 | 3561 | Savvis | 3292 | TDC | 9225 | Level3 AP |
| 9 | 174 | Cogent | 6849 | UKR Telecom | 2764 | Connect |
| 10 | 3491 | Beyond The Network | 5400 | BT Europe | 7473 | SingTel |
We then sort those ASs with
![]() in decreasing order
and assign them ranks, denoted
in decreasing order
and assign them ranks, denoted ![]() .
When different ASs have the same
.
When different ASs have the same ![]() value,
we break ties by the size of the ASs' BGP-advertised address space.
Table 6 lists the top-10 bandwidth reseller ASs.
Most of them are associated with well-known tier-1 ISPs that operate
continent-wide backbone networks. Note that in the European and
Asia-Pacific regions, many top-ranking ASs are telecom companies.
value,
we break ties by the size of the ASs' BGP-advertised address space.
Table 6 lists the top-10 bandwidth reseller ASs.
Most of them are associated with well-known tier-1 ISPs that operate
continent-wide backbone networks. Note that in the European and
Asia-Pacific regions, many top-ranking ASs are telecom companies.
We caution that our assumption of unit bandwidth
requirement per AS may be too simplistic.
For example, business customers which are not assigned public AS
numbers are ignored in the computation of the ![]() value.
A more precise estimate of such intra-AS business customers could be
obtained by examining intra-AS router-level connectivity,
which, unfortunately, is not easy to discover from passive measurements.
We rely here on an AS's address space size to partially account for the
presence of such ``hidden'' customer ASs. Having access to proprietary
information on intra-AS business customers would simplify this problem
considerably.
value.
A more precise estimate of such intra-AS business customers could be
obtained by examining intra-AS router-level connectivity,
which, unfortunately, is not easy to discover from passive measurements.
We rely here on an AS's address space size to partially account for the
presence of such ``hidden'' customer ASs. Having access to proprietary
information on intra-AS business customers would simplify this problem
considerably.
In the absence of readily available information about AS business models, our proposed methodology for inferring an AS's business model is based on the following assumptions: (1) ASs' web service utilities can be gleaned from the usage patterns of a popular web search engine, (2) utilizing widely adopted file sharing applications, an AS's residential access utility can be inferred from the size of its file sharing population, and (3) an AS's business access utility, as measured by its bandwidth distribution, can be estimated by counting its downstream AS customers. A careful study of the robustness of the proposed methodology to violations of these assumptions (e.g., a more URL-dependent network usage, non P2P-based residential access, a more cost-driven approach to providing business access) is necessary, but is left for future work.
Our measurement method identified about 40% of all BGP-advertised ASs as providing some form of Web hosting service, about 30% as providing residential access, and about 15% as providing business access. The collected measurement data sets are available at https://topology.eecs.umich.edu/traffic/. The union of all identified ASs covers about 56% of all BGP-advertised ASs. Although close to 50% of all ASs are not categorized by our method, these are typically small ASs generating negligible traffic volume. For example, according to NetFlow statistics obtained from a regional ISP,We thank Manish Karir for making the NetFlow data available to us. the 56% identified ASs were responsible for 99% of all traffic observed by this ISP. This suggests that our methodology works well for the set of ASs that are responsible for the bulk of Internet traffic, but is of limited use for the many small ASs that contribute little to the overall traffic volume.
As the Internet continues to evolve, so does an AS's business model. However, since our proposed methodology relies mainly on being able to (1) identify the most ``generic'' business elements shared by existing ASs, and (2) infer each of these business elements by relying on appropriate ``surrogate'' measurements (or direct measurements, if available), we argue that our approach will remain applicable under changing Internet conditions (e.g., emergence of new ``killer'' applications), at least as long as generic business elements can be defined and viable surrogate measurements can be identified.
| Tier-1 | Retail service | Business service | Network access | ||||
| AS# | Name | AS# | Name | AS# | Name | AS# | Name |
| 3356 | Level3 | 87 | Indiana Univ. | 14742 | Internap | 6383 | BellSouth |
| 7018 | AT&T WorldNet | 18566 | Covad | 297 | NASA | 6385 | BellSouth |
| 7132 | SBC | 1249 | Univ. of Massachusetts | 6922 | Texas Backbone | 13675 | Verizon |
| 209 | Qwest | 23504 | Speakeasy | 19782 | Indiana Univ. | 19158 | USCarrier |
| 1239 | Sprint | 2637 | Georgia Tech. | 5663 | EDCnet | 19752 | Hydro One |
| 3561 | Savvis | 14 | Columbia Univ. | 18695 | Arbinet | 22573 | Northwestel |
| 701 | UUNet | 25 | UC Berkeley | 5693 | InteleNet | 7776 | Mebtel |
| 852 | Telus | 4130 | PSC | 12179 | N/A | 25899 | NOAnet |
| 577 | Bell Canada | 18 | Univ. of Texas | 11588 | El Dorado | 7843 | Adelphia |
| 5650 | ELI | 20001 | RoadRunner | 4436 | nLayer | 10796 | RoadRunner |
| Web hosting | Residential access | Business access | |||||
| AS# | Name | AS# | Name | AS# | Name | ||
| 16509 | Amazon | 7757 | Comcast | 11537 | UCAID | ||
| 11643 | eBay | 20231 | RoadRunner | 6347 | Savvis | ||
| 14134 | Navisite | 13367 | RoadRunner | 1784 | Global NAPs | ||
| 8070 | Microsoft | 29737 | WideOpenWest | 6020 | DCInet | ||
| 7224 | Amazon | 27699 | TSP | 19151 | IBIS7 | ||
| 11305 | Interland | 19115 | Charter | 2548 | DIGEX | ||
| 6432 | Doubleclick | 22269 | Charter | 3643 | Sprint | ||
| 26101 | Yahoo | 21508 | Comcast | 6509 | Canarie | ||
| 7859 | Pair | 11683 | Earthlink | 293 | Energy Science Net | ||
| 11443 | OLM | 4999 | Sprint | 2153 | CSU | ||
|
From Tables 3, 4,
and 6, one can see that some ASs rank very high
with respect to more than one utility
(e.g., Deutsche Telekom appears in all three), whereas
other ASs rank high in only one category (e.g., Amazon in Web hosting,
and Comcast in residential access). To compare these
multi-variate AS utility profiles, and to associate each AS
with one of the seven profiles listed in Table 1,
we introduce the following quantitative metric.
We first convert the ranks ![]() ,
, ![]() ,
and
,
and ![]() of an AS into their normalized counterparts, denoted
by
of an AS into their normalized counterparts, denoted
by ![]() ,
, ![]() , and
, and ![]() , respectively.
More specifically, we set
, respectively.
More specifically, we set
![]() set of all ASs}, so that
set of all ASs}, so that
![]() .
If
.
If ![]() is unknown, we set it to
is unknown, we set it to
![]() , reflecting our intuition that
, reflecting our intuition that ![]() has negligible
web utility, so that in this case,
has negligible
web utility, so that in this case,
![]() .
Likewise for
.
Likewise for ![]() and
and ![]() .
We then define the rank vector
.
We then define the rank vector
![]() corresponding to
AS X as
corresponding to
AS X as
![]() .
Note that
.
Note that
![]() can be interpreted as a point
in the 3-dimensional hypercube, with the seven business models
listed in Table 1 representing the extreme or
corner points (i.e.,
can be interpreted as a point
in the 3-dimensional hypercube, with the seven business models
listed in Table 1 representing the extreme or
corner points (i.e.,
![]() )
of this hypercube, where 0 and 1 corresponds to ``H'' and ``L'' respectively.
Intuitively, the business model of an AS
)
of this hypercube, where 0 and 1 corresponds to ``H'' and ``L'' respectively.
Intuitively, the business model of an AS ![]() is
determined by the minimal distance between its rank vector
is
determined by the minimal distance between its rank vector
![]() and the seven corner points. For example,
as the rank vector
and the seven corner points. For example,
as the rank vector
![]() gets closer to
gets closer to ![]() ,
the business model of AS
,
the business model of AS ![]() is considered to be
increasingly that of a residential access provider.
is considered to be
increasingly that of a residential access provider.
In Table 7, we list the top 10 North American ASs
for each of the seven business models presented in Table 1.
The top-10 ASs in the ``Tier-1'' category are those whose
rank vectors are closest to the ![]() point in the 3D hypercube.
Likewise for the remaining six categories.
We observe that, first, ASs that are dominant in all
three utility categories are indeed well-known tier-1 ASs.
Second, in the ``Network access'' category where the primary utilities
of the ASs are to provide Internet access to both business and
residential customers, several of the high-ranking ASs are telecom companies.
Third, the business profile of educational institutions falls
under the ``Retail service'' category, where the primary utilities
of an AS are to provide both Web hosting and residential access.
Networks belonging to educational institutions usually host various
academic web sites and at the same time provide Internet access to
students living in university-owned housing.
Fourth, several educational and research ASs are categorized
under ``Business access.'' These ASs serve purely as backbone
networks connecting other smaller institutions' networks.
point in the 3D hypercube.
Likewise for the remaining six categories.
We observe that, first, ASs that are dominant in all
three utility categories are indeed well-known tier-1 ASs.
Second, in the ``Network access'' category where the primary utilities
of the ASs are to provide Internet access to both business and
residential customers, several of the high-ranking ASs are telecom companies.
Third, the business profile of educational institutions falls
under the ``Retail service'' category, where the primary utilities
of an AS are to provide both Web hosting and residential access.
Networks belonging to educational institutions usually host various
academic web sites and at the same time provide Internet access to
students living in university-owned housing.
Fourth, several educational and research ASs are categorized
under ``Business access.'' These ASs serve purely as backbone
networks connecting other smaller institutions' networks.
Next, we examine the correlation between the three utilities
of an AS, for example, is an AS hosting
a large volume of popular web content likely to serve a large
number of residential customers as well?
We use Kendall's rank correlation coefficient [12]
to quantify these pairwise correlations.
For samples
![]() from
a bivariate distribution,
Kendall's (sample)
from
a bivariate distribution,
Kendall's (sample) ![]() coefficient is defined as
coefficient is defined as
![]() , where
, where
![]() = 1 if
= 1 if ![]() , and
, and ![]() if
if ![]() .
Kendall'
.
Kendall' ![]() provides a distribution-free measure of
the strength of the association between two variables (i.e.,
monotonicity between two variables).
The traditional Pearson product-moment correlation coefficient is less
useful if Gaussian assumptions do not hold for the random variables
at hand, as is the case for
provides a distribution-free measure of
the strength of the association between two variables (i.e.,
monotonicity between two variables).
The traditional Pearson product-moment correlation coefficient is less
useful if Gaussian assumptions do not hold for the random variables
at hand, as is the case for ![]() ,
, ![]() , and
, and ![]() .
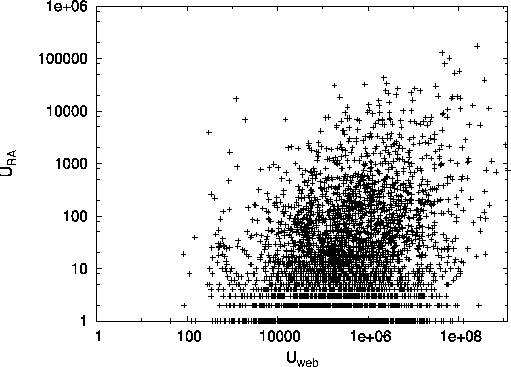
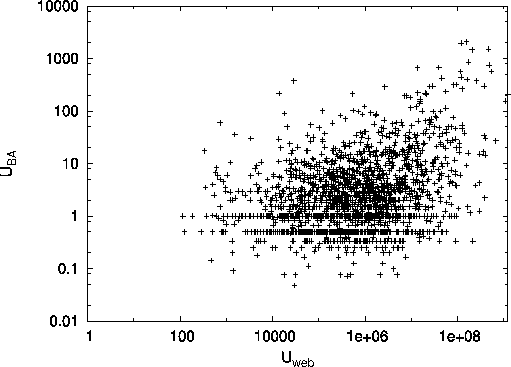
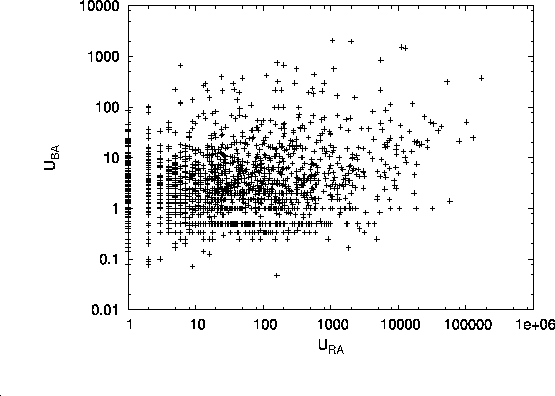
To visualize the relationships between the three inferred utilities,
we show in Fig. 3 pairwise scatterplots for
.
To visualize the relationships between the three inferred utilities,
we show in Fig. 3 pairwise scatterplots for ![]() ,
,
![]() , and
, and ![]() .
The graphs show that there exists non-negligible correlation
between each pair of utilities.
.
The graphs show that there exists non-negligible correlation
between each pair of utilities.
|
Kendall's |
ARIN | RIPE | APNIC | All |
|
|
0.1562 | 0.1540 | 0.1820 | 0.1540 |
|
|
0.2332 | 0.1439 | 0.2032 | 0.1856 |
|
|
0.1864 | 0.2088 | 0.2483 | 0.2068 |
Table 8 lists the resulting Kendall's
(sample) ![]() values for pairwise correlations between
values for pairwise correlations between
![]() ,
, ![]() , and
, and ![]() .
By calculating the pairwise correlation for the three geographic regions
separately, we find that in the European and Asia-Pacific regions,
the correlation between ``residential access'' and ``business access''
is higher than the other two pairwise correlations.
As hypothesized earlier, this higher correlation may be due to
dominance of the ISP market in these regions by incumbent telecom
carriers.
Since the ISP market in the Asia-Pacific countries, in particular,
is highly regulated by the government, it is to be expected that
the entire ISP business in this region is dominated by a few
large telecom carriers. In the North American region, on the
other hand, the correlation between ``residential access''
and ``business access'' is relatively low, reflecting a less
regulated environment.
.
By calculating the pairwise correlation for the three geographic regions
separately, we find that in the European and Asia-Pacific regions,
the correlation between ``residential access'' and ``business access''
is higher than the other two pairwise correlations.
As hypothesized earlier, this higher correlation may be due to
dominance of the ISP market in these regions by incumbent telecom
carriers.
Since the ISP market in the Asia-Pacific countries, in particular,
is highly regulated by the government, it is to be expected that
the entire ISP business in this region is dominated by a few
large telecom carriers. In the North American region, on the
other hand, the correlation between ``residential access''
and ``business access'' is relatively low, reflecting a less
regulated environment.
The proposed traffic demand model
builds on our AS business characterization by using
as key input the ASs' inferred utility profiles (i.e., ![]() ,
,
![]() and
and ![]() ). We show how the new model can be used
in conjunction with a given AS graph to generate realistic inter-domain
traffic demand.
). We show how the new model can be used
in conjunction with a given AS graph to generate realistic inter-domain
traffic demand.
For describing inter-domain traffic demands,
we postulate a general gravity model
(see for example [23] and references therein),
where traffic flow from body ![]() to body
to body ![]() (denoted
(denoted ![]() )
is assumed to satisfy
)
is assumed to satisfy
Repulsive, attractive factors. We assume that a majority of inter-domain traffic in today's Internet can be attributed to two kinds of interactions: (i) communication between web servers and clients (called ``web'' traffic), and (ii) communication between two clients (called ``inter-residential'' traffic). Web surfing and media streaming belong to the first category, Email and file sharing belong to the second category.
A typical web transaction is an asymmetric two-way communication:
client's request for web resource, and the corresponding response
from the server. Thus, web traffic from AS ![]() to AS
to AS ![]() can be
attributed to either a server in AS
can be
attributed to either a server in AS ![]() returning web content requested
by a client in AS
returning web content requested
by a client in AS ![]() , or a client in AS
, or a client in AS ![]() sending a request for web
content served by a server in AS
sending a request for web
content served by a server in AS ![]() .
In the context of the gravity model, we model the volume of web traffic
as a function of an AS's client population size and web content
population size. Let
.
In the context of the gravity model, we model the volume of web traffic
as a function of an AS's client population size and web content
population size. Let ![]() be the client population size of
AS
be the client population size of
AS ![]() and
and ![]() the web content population size of the AS.
The volume of ``web'' traffic from AS
the web content population size of the AS.
The volume of ``web'' traffic from AS ![]() to AS
to AS ![]() is then quantitatively expressed as the weighted sum of two products:
is then quantitatively expressed as the weighted sum of two products:
![]() .
The first term corresponds to the ``response'' traffic
from AS
.
The first term corresponds to the ``response'' traffic
from AS ![]() (of population size
(of population size ![]() )
to clients in AS
)
to clients in AS ![]() (of population size
(of population size ![]() ).
The second term corresponds to the ``request'' traffic from
clients in AS
).
The second term corresponds to the ``request'' traffic from
clients in AS ![]() for web content in AS
for web content in AS ![]() .
The parameter
.
The parameter ![]() is the ratio of request traffic
over response traffic, usually significantly less than 1.
is the ratio of request traffic
over response traffic, usually significantly less than 1.
The symmetric inter-residential traffic from AS ![]() to AS
to AS ![]() is modeled as
is modeled as
![]() .
The parameter
.
The parameter ![]() is a normalization factor that determines the
relative weight of web traffic and inter-residential traffic.
Combining web and inter-residential traffic,
the total traffic volume from AS
is a normalization factor that determines the
relative weight of web traffic and inter-residential traffic.
Combining web and inter-residential traffic,
the total traffic volume from AS ![]() to AS
to AS ![]() can be
estimated as:
can be
estimated as:
![]() .
.
A key factor in specifying our traffic demand model concerns
the issue of modeling the quantities
![]() and
and
![]() . However, as seen earlier in Section 4,
the empirically derived quantities
. However, as seen earlier in Section 4,
the empirically derived quantities
![]() and
and ![]() are in fact estimates of the population of web content and
the population of clients, respectively, and are thus natural
drivers of our gravity model. More generally,
are in fact estimates of the population of web content and
the population of clients, respectively, and are thus natural
drivers of our gravity model. More generally, ![]() and
and ![]() can be modeled as
can be modeled as
![]() and
and
![]() ,
where
,
where ![]() and
and ![]() are
monotonically decreasing rank-size functions; for example, in the
case where
are
monotonically decreasing rank-size functions; for example, in the
case where
![]() follows roughly a type-1 Pareto distribution,
follows roughly a type-1 Pareto distribution,
![]() .
.
Friction factor. In urban transportation studies, the friction factor of the gravity model is typically a function of the distance between two regions. In estimating intra-domain traffic demand using the gravity model, Zhang et al. [23] assume a common, constant friction factor. In the inter-AS environment, such an assumption may not be realistic. For example, an over-provisioned path between two ASs may increase traffic flow between them, whereas an under-provisioned path is likely to decrease traffic flow between them.
Based on this observation, we define the friction factor between AS ![]() and AS
and AS ![]() as
as
![]() , where
, where
![]() and
and ![]() denotes the set of transit ASs in the path
between AS
denotes the set of transit ASs in the path
between AS ![]() and AS
and AS ![]() .
As defined in the previous section,
.
As defined in the previous section, ![]() is the rank of AS
is the rank of AS ![]() among all business access providers.
among all business access providers.
![]() is thus the maximum rank
of a transit AS between AS
is thus the maximum rank
of a transit AS between AS ![]() and AS
and AS ![]() .
Assuming that an AS with higher
transit rank is more likely to maintain a well-provisioned network, this
definition of the friction factor captures the transit quality of the
bottleneck AS of a given path. By tuning the parameter
.
Assuming that an AS with higher
transit rank is more likely to maintain a well-provisioned network, this
definition of the friction factor captures the transit quality of the
bottleneck AS of a given path. By tuning the parameter ![]() ,
we can study the sensitivity of traffic demand as a function of
the transit network quality (a smaller
,
we can study the sensitivity of traffic demand as a function of
the transit network quality (a smaller ![]() means lower variability
in transit quality).
means lower variability
in transit quality).
Remarks: Note that the original gravity model postulates
that interactions between nodes are independent. On the
one hand, this assumption seems reasonable for modeling highly
aggregated quantities such as inter-domain traffic flows, where the
latter are, in general, sufficiently aggregated so that possible
dependencies among finer-grained traffic flows can be safely
ignored. On the other hand, by defining the friction factor in
terms of ![]() , we may introduce subtle dependencies
among inter-domain traffic flows, as
, we may introduce subtle dependencies
among inter-domain traffic flows, as ![]() is not independent
of
is not independent
of ![]() if
if ![]() is a downstream customer of
is a downstream customer of ![]() , or vice versa.
In this sense, the proposed ``general gravity model'' is not a
gravity model in the strict sense, but allows for dependencies that
may be genuine at the Internet's AS level, where inter-dependent
traffic engineering is not uncommon.
, or vice versa.
In this sense, the proposed ``general gravity model'' is not a
gravity model in the strict sense, but allows for dependencies that
may be genuine at the Internet's AS level, where inter-dependent
traffic engineering is not uncommon.
| (2) |
To produce the resulting inter-domain traffic demand matrix,
we first generate for each node (AS ![]() ) in the graph
its rankings in terms of the three utilities we identified
(
) in the graph
its rankings in terms of the three utilities we identified
(
![]() ,
,
![]() ,
,
![]() ).
When generating these rank vectors, we must account for
the pairwise correlation between the rankings as reported in
Section 4. By definition, the ranking
).
When generating these rank vectors, we must account for
the pairwise correlation between the rankings as reported in
Section 4. By definition, the ranking
![]() is determined solely by the topology
of a given graph. Given a graph,
is determined solely by the topology
of a given graph. Given a graph,
![]() can
be computed independent of the other two rankings.
Using
can
be computed independent of the other two rankings.
Using
![]() as an
anchor, we next generate
as an
anchor, we next generate
![]() and
and
![]() based on a well-known method for generating
multi-variate normal random numbers [18].
Our rank generation algorithm is described
in Table 9. The input parameters to our algorithm
are the AS graph and a
based on a well-known method for generating
multi-variate normal random numbers [18].
Our rank generation algorithm is described
in Table 9. The input parameters to our algorithm
are the AS graph and a ![]() rank correlation matrix
rank correlation matrix
![]() = {
= {![]() }.
}.
| Input: AS graph with |
| Algorithm: |
| // generation of
|
| Compute |
| Assign
|
| // generation of
|
| Convert |
|
|
| Compute a lower-triangular matrix |
|
| Generate ( |
|
| Obtain ( |
| Assign
|
| Assign
|
| Output: (
|
Recall that our empirical approach to determining the input data (i.e., utility profile-based AS business models) that drives the gravity model proposed in Section 5 is based exclusively on publicly obtainable/available data sets and does not use any actual traffic volume measurements. Thus a natural starting point for attempting to validate many aspects of our inter-domain traffic demand model is to gain access to traffic volume-related AS-specific data sets which are in general not publicly available. We follow this strategy by relying on a week's worth of (sampled) NetFlow measurements from a regional ISP. The data sets were collected from one of its access routers around the same time when we performed our own measurement experiments described in Section 3 (i.e., Oct. 2004). The captured traffic originates from or is destined to the ISP's networks, and the data sets contain, among other information, source/destination IP address prefixes of length at most 24 (due to anonymization), source/destination port numbers, and size of each traffic flow. We use these actual traffic measurements (i) to check a basic assumption underlying our gravity model, namely that the inter-domain traffic demand is determined by ``web'' and ``inter-residential'' traffic, (ii) to explore the adequacy of our key decision to use ``surrogate'' traffic measurements (e.g., data measuring the appearance of web content in search results, estimates for the number of P2P file-sharing users) instead of actual traffic volume estimates, and (iii) to provide a preliminary comparison between actual inter-domain traffic demand and those generated by our model.
To check the assumption explicit in Equation (2) that inter-AS traffic demand consists of the two components, ``web'' traffic and ``inter-residential'' traffic, we classify the flows in our NetFlow data set into ``web'' traffic and ``inter-residential'' traffic, using an up-to-date list of well-known port numbers. Given a traffic flow, if either source or destination port number is assigned to well-known web service (e.g., http, nntp, streaming), the flow is marked as ``web'' traffic. If either source or destination port number is associated with a well-known P2P file sharing application, the flow is marked as ``inter-residential'' traffic. However, an increasing number of applications do not use well-known port numbers, which makes it difficult to fully identify network traffic type based on port numbers alone. To improve upon the above naive traffic classification, for flows we cannot identify by source/destination port pair, we examine their source and destination address prefixes to heuristically infer its application type. More specifically, we randomly choose two IP addresses, one from each the source address prefix and destination address prefix, and perform a reverse DNS lookup. If either one of them has web-service related domain names (e.g., www* or web*), then we mark the flow as ``web'' traffic. If both IP addresses are resolved to well-known residential network domains (e.g., reshall.umich.edu or comcast.net), we mark the flow as ``inter-residential'' traffic.
| Classification | Web | Inter-residential | Unknown |
| Port-based | 30.2% | 28.8% | 40.0% |
| Port-based + Heuristic | 31.6% | 36.0% | 32.4% |
Table 10 reports our traffic classification result. The reported percentages are based on total volumes of traffic. Although applying our heuristic reduces the amount of unknown traffic by 8%, uncategorized traffic still accounts for one-third of all traffic, consistent with other available numbers [4]. We thus observe that with currently available traffic classification methods, our model appears to capture at least two thirds of actual inter-AS traffic. Improvements of state-of-the-art traffic classification techniques (e.g., [11]) can be expected to show a more accurate coverage of inter-AS traffic by our model.
Our methodology described in Section 3 for inferring an AS's
utility profile and determining in turn its business model
avoids on purpose actual traffic volume-related measurements.
Instead, we rely on ``surrogate'' traffic measurements such as
appearances of web content in search results or estimates of
an AS's P2P file sharing population and assume that the latter
are viable substitutes for the largely inaccessible
actual traffic data. To check this assumption, we rely again
on our NetFlow data sets and extract from them three distinct
traffic volume measurements for each AS ![]() :
: ![]() ,
,
![]() , and
, and ![]() , which correspond to ``web-hosting''
traffic, ``residential access'' traffic, and ``business access''
traffic, respectively. Using our classification of traffic
in Section 6.1 into ``web'' and ``inter-residential'' traffic.
we compute
, which correspond to ``web-hosting''
traffic, ``residential access'' traffic, and ``business access''
traffic, respectively. Using our classification of traffic
in Section 6.1 into ``web'' and ``inter-residential'' traffic.
we compute
![]() and
and ![]() ,
as described in Table 11.
,
as described in Table 11.
|
|
| for each traffic flow |
|
|
|
|
|
|
|
|
|
|
|
|
|
|
The ``business-access'' traffic ![]() captures
the volume of traffic going through AS
captures
the volume of traffic going through AS ![]() .
To compute
.
To compute ![]() , we use Gao's heuristics [10]
to construct an AS-level routing path for each
source-destination pair.
We then increment
, we use Gao's heuristics [10]
to construct an AS-level routing path for each
source-destination pair.
We then increment ![]() of every transit AS between the
source-destination pair by the size of each flow.
of every transit AS between the
source-destination pair by the size of each flow.
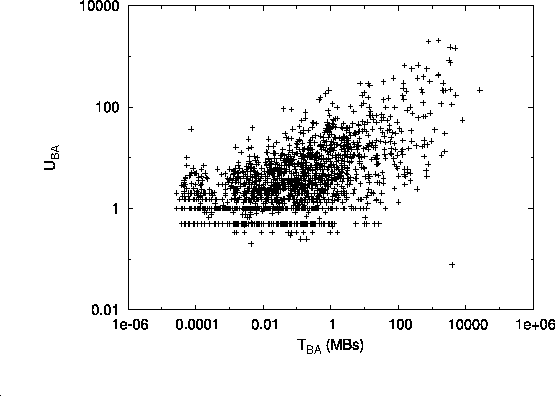
Fig. 4 shows how well our inferred utilities
(i.e., ![]() ,
, ![]() and
and ![]() ) compare
to their actual traffic-derived counterparts (i.e.,
) compare
to their actual traffic-derived counterparts (i.e., ![]() ,
,
![]() and
and ![]() ). We observe that
in all three cases, ASs with high inferred utilities
also have high measured traffic volumes.
In Table 12, we quantify the pairwise correlation
of
). We observe that
in all three cases, ASs with high inferred utilities
also have high measured traffic volumes.
In Table 12, we quantify the pairwise correlation
of ![]() ,
, ![]() ,
, ![]() , just as we did earlier in
Table 8 with the inferred utilities
, just as we did earlier in
Table 8 with the inferred utilities ![]() ,
,
![]() , and
, and ![]() . Comparing Tables 8
and 12, we note that the pairwise correlation
values are slightly underestimated by our methodologies, more so
in the North American region than in the other regions. Overall,
while the actual values differ, the generally low degree of pairwise
correlations in
. Comparing Tables 8
and 12, we note that the pairwise correlation
values are slightly underestimated by our methodologies, more so
in the North American region than in the other regions. Overall,
while the actual values differ, the generally low degree of pairwise
correlations in ![]() ,
, ![]() , and
, and ![]() is consistent with
what we observed earlier for the inferred utilities
is consistent with
what we observed earlier for the inferred utilities ![]() ,
,
![]() , and
, and ![]() , which suggests that our assumption of
using appropriate ``surrogate'' traffic measurements instead of
actual traffic measurements is not obviously unreasonable. However,
there is clearly room for significant improvements.
, which suggests that our assumption of
using appropriate ``surrogate'' traffic measurements instead of
actual traffic measurements is not obviously unreasonable. However,
there is clearly room for significant improvements.
|
Kendall's |
ARIN | RIPE | APNIC | All |
|
|
0.2490 | 0.1816 | 0.2752 | 0.2410 |
|
|
0.1970 | 0.2467 | 0.2826 | 0.2440 |
|
|
0.1973 | 0.2489 | 0.2157 | 0.2371 |
|
Ultimately, any inter-domain traffic demand model will be
judged by how well the results compare to actual Internet data.
In our attempt to provide such an initial comparison,
we check whether our model, when combined with an inferred
Internet AS graph and when appropriately parameterized,
is capable of generating realistic traffic demand, consistent
with actual demand measured in the Internet.
To this end, we use an inferred Internet AS graph consisting of
18,221 nodes and 39,558 edges, and since our NetFlow data sets
were collected from a single vantage point on the Internet,
we compare model-generated traffic demand of a single
source node against NetFlow traffic information, where the
source node is chosen to be an AS ![]() that has a business model
comparable to that of the AS from which the NetFlow measurements
were collected.
We also present some preliminary result concerning
the sensitivity of the generated inter-domain traffic matrix
to the choice of model parameters.
that has a business model
comparable to that of the AS from which the NetFlow measurements
were collected.
We also present some preliminary result concerning
the sensitivity of the generated inter-domain traffic matrix
to the choice of model parameters.
Given the Internet-like pairwise rank correlation (i.e., ![]() taken
from the ``All'' column of Table 8),
we assign ranks to each node based the method
described in Section 5.2, considering the special case where
the quantities
taken
from the ``All'' column of Table 8),
we assign ranks to each node based the method
described in Section 5.2, considering the special case where
the quantities
![]() and
and ![]() are given by
type-1 Pareto distributions, i.e.,
are given by
type-1 Pareto distributions, i.e.,
![]() and
and
![]() , with
, with
![]() .
Using this model, we then generate the traffic demand
.
Using this model, we then generate the traffic demand ![]() that
each node
that
each node ![]() maintains with our chosen source node
maintains with our chosen source node ![]() (i.e.,
(i.e., ![]() =
= ![]() +
+ ![]() ). At the same time,
relying on the NetFlow data sets, we also obtain the measured
traffic demand between each AS and the NetFlow collector AS,
the regional ISP from which the NetFlow data was obtained.
). At the same time,
relying on the NetFlow data sets, we also obtain the measured
traffic demand between each AS and the NetFlow collector AS,
the regional ISP from which the NetFlow data was obtained.
Fig. 5(a) compares model-generated traffic volumes with
NetFlow-derived traffic volumes by showing volume vs. rank
distributions.The random parameterization of ![]() and
and ![]() reflect AS-dependent variations of traffic components.
In the case of the NetFlow-derived volume measurements,
the traffic demand starts to fall steeply after rank 1000 or so,
while the model-generated demand does not. This deviation is likely
due to a deficiency of the type-1 Pareto distribution (used to
model
reflect AS-dependent variations of traffic components.
In the case of the NetFlow-derived volume measurements,
the traffic demand starts to fall steeply after rank 1000 or so,
while the model-generated demand does not. This deviation is likely
due to a deficiency of the type-1 Pareto distribution (used to
model ![]() and
and ![]() ) as suggested by Figs. 1
and 2.
In Fig. 5(b), we plot the cumulative traffic
demand ratio; i.e., we examine what percentage of the total traffic
demand the top-
) as suggested by Figs. 1
and 2.
In Fig. 5(b), we plot the cumulative traffic
demand ratio; i.e., we examine what percentage of the total traffic
demand the top-![]() percent ASs are responsible for.
The actual traffic demand ratios of the top-ranking ASs (up to rank 30
or so) are matched well by our model, but for the same reason as before,
the generated demand ratios start to deviate considerably from their
actual counterparts when we include the lower-ranking ASs.
percent ASs are responsible for.
The actual traffic demand ratios of the top-ranking ASs (up to rank 30
or so) are matched well by our model, but for the same reason as before,
the generated demand ratios start to deviate considerably from their
actual counterparts when we include the lower-ranking ASs.
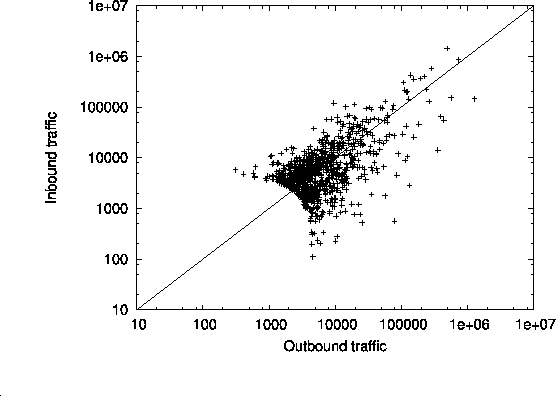
Finally, to compare model-generated and actual demand in terms of
outbound and inbound traffic profiles, we plot in Fig. 6
for each node or AS ![]() on the
on the ![]() -axis the volume of traffic from
-axis the volume of traffic from
![]() to
to ![]() , and on the
, and on the ![]() -axis the volume of traffic from
-axis the volume of traffic from ![]() to
to ![]() .
Since we already know that our model is inadequate for predicting small ASs'
traffic demand, we focus in the figure on the large ASs (i.e., top-1000
ASs in terms of their total traffic demand) to get an idea about how well
our model predicts the inbound/outbound traffic for the critical large ASs.
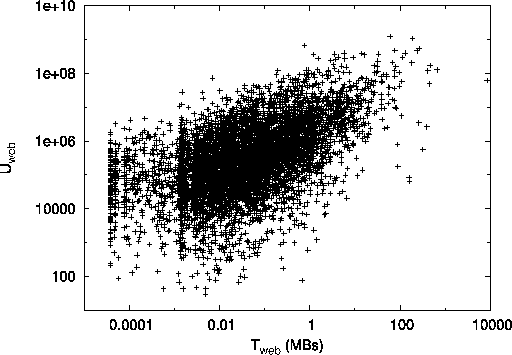
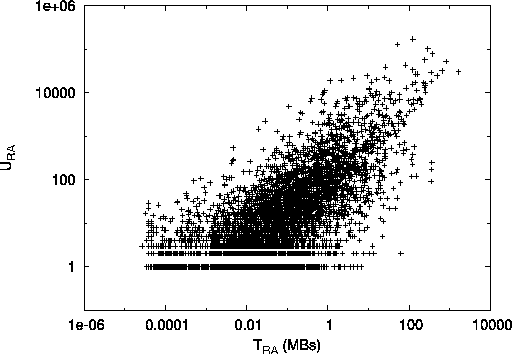
Fig. 6(a) shows the profile obtained from using
NetFlow measurements, while Fig. 6(b) depicts
the profile resulting from our model-generated inter-domain demand.
As the traffic profile of an AS moves further below
the diagonal line, its business profile becomes increasingly that of
a web service provider. Conversely, an AS whose traffic profile
is located above the diagonal line is a typical residential access provider.
Comparing the two profiles in Fig. 6, we see that
the NetFlow-derived values are comparable to their model-generated
counterparts, with less concentration around the diagonal, though.
.
Since we already know that our model is inadequate for predicting small ASs'
traffic demand, we focus in the figure on the large ASs (i.e., top-1000
ASs in terms of their total traffic demand) to get an idea about how well
our model predicts the inbound/outbound traffic for the critical large ASs.
Fig. 6(a) shows the profile obtained from using
NetFlow measurements, while Fig. 6(b) depicts
the profile resulting from our model-generated inter-domain demand.
As the traffic profile of an AS moves further below
the diagonal line, its business profile becomes increasingly that of
a web service provider. Conversely, an AS whose traffic profile
is located above the diagonal line is a typical residential access provider.
Comparing the two profiles in Fig. 6, we see that
the NetFlow-derived values are comparable to their model-generated
counterparts, with less concentration around the diagonal, though.
To illustrate the effect of parameterization of our gravity
model (2), we consider the parameter ![]() .
which determines how variable the transit quality of different networks is.
A high value of
.
which determines how variable the transit quality of different networks is.
A high value of ![]() means that the transit quality of the higher-tier ASs
is significantly better than that of the lower-tier ASs, and a low value of
means that the transit quality of the higher-tier ASs
is significantly better than that of the lower-tier ASs, and a low value of
![]() implies a more uniform transit quality.
In an extreme case where
implies a more uniform transit quality.
In an extreme case where ![]() , the transit quality of
all transit networks is considered the same.
As described in Section 5, the friction factor
, the transit quality of
all transit networks is considered the same.
As described in Section 5, the friction factor ![]() ,
which is a function of
,
which is a function of ![]() , reflects the transit quality of the
path bottleneck and is thus a topological metric that depends on graph
connectivity. To examine the effect of
, reflects the transit quality of the
path bottleneck and is thus a topological metric that depends on graph
connectivity. To examine the effect of ![]() in terms
of its impact on the topological distribution of traffic demand,
for a given path length
in terms
of its impact on the topological distribution of traffic demand,
for a given path length ![]() , let
, let ![]() denote the total sum of
traffic exchanged between every pair of ASs that are distance
denote the total sum of
traffic exchanged between every pair of ASs that are distance ![]() apart.
We are interested in understanding how, depending on the parameter
apart.
We are interested in understanding how, depending on the parameter ![]() ,
,
![]() changes with different path length
changes with different path length ![]() .
.
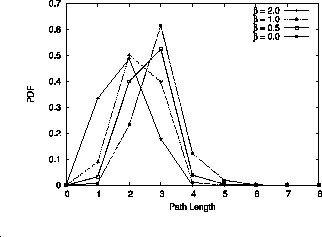
Fig. 7 shows the probability density functions of ![]() for different values of
for different values of ![]() .
As
.
As ![]() increases, the entire density function is shifted to the left.
Intuitively, in a high-
increases, the entire density function is shifted to the left.
Intuitively, in a high-![]() setting, the total traffic demand is
more likely to be dominated by the demand between close-by
source-destination pairs; demand between far-away pairs becomes negligible,
(long paths are more likely to encounter a bottleneck than short paths
and will be avoided). In short, a high-
setting, the total traffic demand is
more likely to be dominated by the demand between close-by
source-destination pairs; demand between far-away pairs becomes negligible,
(long paths are more likely to encounter a bottleneck than short paths
and will be avoided). In short, a high-![]() setting
imitates an Internet environment where traffic demand tends to be
highly localized [22].
In contrast, in a low-
setting
imitates an Internet environment where traffic demand tends to be
highly localized [22].
In contrast, in a low-![]() setting, traffic
demand tends to be less sensitive to the bottleneck quality between
source and destination, resulting in distant source-destination pairs
exchanging non-negligible amount of traffic.
setting, traffic
demand tends to be less sensitive to the bottleneck quality between
source and destination, resulting in distant source-destination pairs
exchanging non-negligible amount of traffic.
Besides the parameter ![]() , we also examine the pairwise rank correlation
matrix
, we also examine the pairwise rank correlation
matrix
![]() and study the
traffic profiles resulting from different degrees of rank correlation.
As expected, increasing pairwise rank correlation results in higher correlation
between outbound traffic associated with web hosting utility and inbound
traffic attributed to residential access utility.
Due to space limitation, we do not include the detailed results.
and study the
traffic profiles resulting from different degrees of rank correlation.
As expected, increasing pairwise rank correlation results in higher correlation
between outbound traffic associated with web hosting utility and inbound
traffic attributed to residential access utility.
Due to space limitation, we do not include the detailed results.
The Internet AS environment is a setting where establishing ``ground truth'' is notoriously difficult. For example, while it is relatively easy to infer AS maps of the Internet from publicly available BGP-derived data, the underlying measurements are known to provide only a very incomplete picture of Internet connectivity at the AS-level [5]. In turn, this creates significant challenges for accurately modeling the Internet's AS topology and large unresolved problems as far as validating the resulting models is concerned.
In this paper, we are concerned with an even more elusive aspect of the Internet's AS environment, namely the AS-level traffic matrix giving the traffic demand between any pair of connected ASs. For one, there exists no equivalent of the publicly available BGP-derived data, and this has led researchers to pursue a mostly model-based approach. Even worse, for fear of losing competitive advantage, ASs are very reluctant to provide any AS-related data. As a result, AS-specific traffic data is by and large not publicly available, causing researchers to look for ``surrogate'' measurements that are publicly available or obtainable (i.e., via measurement experiments that can be performed by anyone connected to the Internet) and that may shed some light on the nature of the actual inter-AS traffic demand. As far as model validation is concerned, this situation causes nightmares, because on top of examining the validity of a proposed model, it first requires checking that the considered surrogate measurements are indeed suitable and relevant as substitutes for the largely unavailable data.
By developing a flexible approach to generating inter-AS traffic matrices, we make four specific contributions:
While many of the specific details of our approach can be questioned and much room for improvements exist, we have demonstrated that overall, it is not only feasible, but also generates realistic inter-AS traffic demand with Internet-like characteristics. The chosen parameterization makes our model an attractive object for exploring ``what-if'' scenarios; by relating it to recent successful attempts at modeling intra-AS traffic demand, our model provides an initial framework within which one can start exploring the impact of intra-AS traffic engineering on inter-AS traffic engineering and vice versa.
This document was generated using the LaTeX2HTML translator Version 2002-2-1 (1.70)
Copyright © 1993, 1994, 1995, 1996,
Nikos Drakos,
Computer Based Learning Unit, University of Leeds.
Copyright © 1997, 1998, 1999,
Ross Moore,
Mathematics Department, Macquarie University, Sydney.
The command line arguments were:
latex2html -split 0 -show_section_numbers -local_icons camera_eps.tex
The translation was initiated by Hyunseok Chang on 2005-07-22
|
Last changed: 22 Sept. 2005 aw |

 (a) Web hosting vs. residential access
 (b) Web hosting vs. business access
 (c) Residential vs. business access
 (a) Web hosting
 (b) Residential access
 (c) Business access
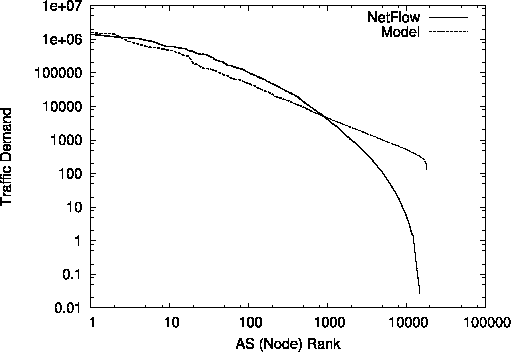 (a) Traffic demand vs. rank
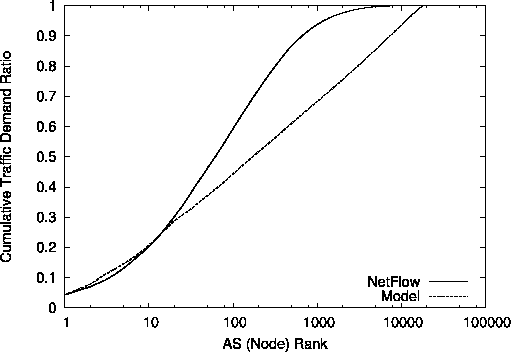 (b) Traffic demand ratio
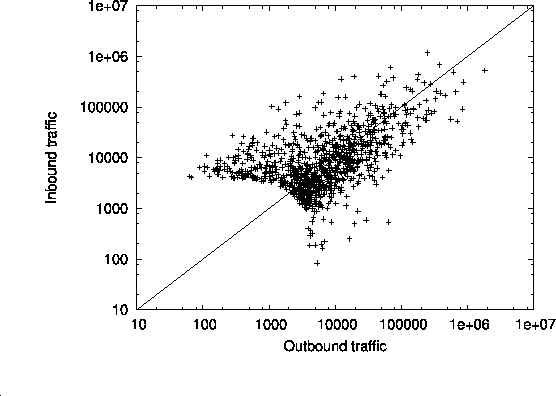 (a) NetFlow
 (b) Model