
![[*]](footnote.png) SALSA: Analyzing Logs as StAte Machines
SALSA: Analyzing Logs as StAte Machines
Most software systems collect logs of programmer-generated messages for various uses, such as troubleshooting, tracking user requests (e.g. HTTP access logs), etc. These logs typically contain unstructured free-form text, making them relatively harder to analyze than numerical system-data (e.g., CPU usage). However, logs often contain semantically richer information than numerical system/resource utilization statistics, since the log messages often capture the intent of the programmer of the system to record events of interest.
SALSA, our approach to automated system-log analysis, involves examining logs to trace control-flow and data-flow execution in a distributed system, and to derive state-machine-like views of the system's execution on each node. Figure 1 depicts the core of SALSA's approach. As log data is only as accurate as the programmer who implemented the logging points in the system, we can only infer the state-machines that execute within the target system. We cannot (from the logs), and do not, attempt to verify whether our derived state-machines faithfully capture the actual ones executing within the system. Instead, we leverage these derived state-machines to support different kinds of useful analyses: to understand/visualize the system's execution, to discover data-flows in the system, to discover bugs, and to localize performance problems and failures.
To the best of our knowledge, SALSA is the first log-analysis technique that aims to derive state-machine views from unstructured text-based logs, to support visualization, failure-diagnosis and other uses. In this paper, we apply SALSA's approach to the logs generated by Hadoop [7], the open-source implementation of Map/Reduce [5]. Concretely, our contributions are: (i) a log-analysis approach that extracts state-machine views of a distributed system's execution, with both control-flow and data-flow, (ii) a usage scenario where SALSA is beneficial in preliminary failure diagnosis for Hadoop, and (iii) a second usage scenario where SALSA enables the visualization of Hadoop's distributed behavior.
SALSA aims to analyze the target system's logs to derive the control-flow on each node, the data-flow across nodes, and the state-machine execution of the system on each node. When parsing the logs, SALSA also extracts key statistics (state durations, inter-arrival times of events, etc.) of interest. To demonstrate SALSA's value, we exploit the SALSA-derived state-machine views and their related statistics for visualization and failure diagnosis. SALSA does not require any modification of the hosted applications, middleware or operating system.
To describe SALSA's high-level operation, consider a distributed
system with many producers, ![]() , and many consumers,
, and many consumers, ![]() .
Many producers and consumers can be running on any host at any point
in time. Consider one execution trace of two tasks,
.
Many producers and consumers can be running on any host at any point
in time. Consider one execution trace of two tasks, ![]() and
and ![]() on a
host
on a
host ![]() (and task
(and task ![]() on host
on host ![]() ) as captured by a sequence of
time-stamped log entries at host
) as captured by a sequence of
time-stamped log entries at host ![]() :
:
![\begin{lstlisting}[breaklines=true,basicstyle=\scriptsize ,tabsize=2]
[t1] Begin...
...t8] Task C1 consumes data from P2 on host Y
[t9] Task C1 ends
:
\end{lstlisting}](img11.png)
From the log, it is clear that the executions (control-flows) of ![]() and
and ![]() interleave on host
interleave on host ![]() . It is also clear that the log
captures a data-flow for
. It is also clear that the log
captures a data-flow for ![]() with
with ![]() and
and ![]() .
.
SALSA interprets this log of events/activities as
a sequence of states. For example, SALSA considers the
period ![]() to represent the duration of state
to represent the duration of state ![]() (where a
state has well-defined entry and exit points corresponding to the
start and the end, respectively, of task
(where a
state has well-defined entry and exit points corresponding to the
start and the end, respectively, of task ![]() ). Other states that can
be derived from this log include the state
). Other states that can
be derived from this log include the state ![]() , the data-consume
state for
, the data-consume
state for ![]() (the period during which
(the period during which ![]() is consuming
data from its producers,
is consuming
data from its producers, ![]() and
and ![]() ), etc. Based on these derived
state-machines (in this case, one for
), etc. Based on these derived
state-machines (in this case, one for ![]() and another for
and another for ![]() ),
SALSA can derive interesting statistics, such as the durations
of states.
),
SALSA can derive interesting statistics, such as the durations
of states.
SALSA can then compare these statistics and the sequences of states across
hosts in the system. In addition,
SALSA can extract data-flow models, e.g., the fact that ![]() depends
on data from its local host,
depends
on data from its local host, ![]() , as well as a remote host,
, as well as a remote host, ![]() . The
data-flow model can be useful to visualize and examine any data-flow
bottlenecks or dependencies that can cause failures to escalate across
hosts.
. The
data-flow model can be useful to visualize and examine any data-flow
bottlenecks or dependencies that can cause failures to escalate across
hosts.
Non-Goals. We do not seek to validate or improve the
accuracy or the completeness of the logs, nor to validate our derived
state-machines against the actual ones of the target system. Rather,
our focus has been on the analyses that we can perform on the logs in
their existing form.
It is not our goal, either, to demonstrate complete use cases for SALSA. For example, while we demonstrate one application of SALSA for failure diagnosis, we do not claim that this failure-diagnosis technique is complete nor perfect. It is merely illustrative of the types of useful analyses that SALSA can support.
Finally, while we can support an online version of SALSA that would analyze log entries generated as the system executes, the goal of this paper is not to describe such an online log-analysis technique or its runtime overheads. In this paper, we use SALSA in an offline manner, to analyze logs incrementally.
Assumptions.
We assume that the logs faithfully capture events and their causality
in the system's execution. For instance, if the log declares that
event ![]() happened before event
happened before event ![]() , we assume that is indeed the
case, as the system executes. We assume that the logs record each
event's timestamp with integrity, and as close in time (as possible)
to when the event actually occurred in the sequence of the system's
execution. Again, we recognize that, in practice, the preemption of
the system's execution might cause a delay in the occurrence of an
event
, we assume that is indeed the
case, as the system executes. We assume that the logs record each
event's timestamp with integrity, and as close in time (as possible)
to when the event actually occurred in the sequence of the system's
execution. Again, we recognize that, in practice, the preemption of
the system's execution might cause a delay in the occurrence of an
event ![]() and the corresponding log message (and timestamp generation)
for entry into the log. We do not expect the occurrence of an event
and the recording of its timestamp/log-entry to be atomic. However, we
do assume that clocks are loosely synchronized across hosts for correlating
events across logs from different hosts.
and the corresponding log message (and timestamp generation)
for entry into the log. We do not expect the occurrence of an event
and the recording of its timestamp/log-entry to be atomic. However, we
do assume that clocks are loosely synchronized across hosts for correlating
events across logs from different hosts.
Event-based analysis. Many studies of system logs treat them as sources of failure events. Log analysis of system errors typically involves classifying log messages based on the preset severity level of the reported error, and on tokens and their positions in the text of the message [14] [11]. More sophisticated analysis has included the study of the statistical properties of reported failure events to localize and predict faults [15] [11] [9] and mining patterns from multiple log events [8].
Our treatment of system logs differs from such techniques that treat logs as purely a source of events: we impose additional semantics on the log events of interest, to identify durations in which the system is performing a specific activity. This provides context of the temporal state of the system that a purely event-based treatment of logs would miss, and this context alludes to the operational context suggested in [14], albeit at the level of the control-flow context of the application rather than a managerial one. Also, since our approach takes log semantics into consideration, we can produce views of the data that can be intuitively understood. However, we note that our analysis is amenable only to logs that capture both normal system activity events and errors.
Request tracing.
Our view of system logs as providing a control-flow perspective of
system execution, when coupled with log messages which have unique
identifiers for the relevant request or processing task, allows us to
extract request-flow views of the system. Much work has been done to
extract request-flow views of systems, and these request flow views
have then been used to diagnose and debug performance problems in
distributed systems [2]
[1]. However, [2] used
instrumentation in the application and middleware to track requests
and explicitly monitor the states that the system goes through, while
[1] extracted causal flows from messages in a
distributed system using J2EE instrumentation developed by
[4]. Our work differs from these request-flow tracing
techniques in that we can causally extract request flows of the system
without added instrumentation given system logs, as described in
§ 7.
Log-analysis tools.
Splunk [10] treats logs as searchable text indexes, and
generates visualizations of the log; Splunk treats logs similarly to
other log-analysis techniques, considering each log entry as an
event. There exist commercial open-source [3] tools for
visualizing the data in logs based on standardized logging mechanisms,
such as
log4j [12]. To the best of our knowledge, none of these tools
derive the control-flow, data-flow and state-machine views that
SALSA does.
Hadoop [7] is an open-source implementation of Google's Map/Reduce [5] framework that enables distributed, data-intensive, parallel applications by decomposing a massive job into smaller tasks and a massive data-set into smaller partitions, such that each task processes a different partition in parallel. The main abstractions are (i) Map tasks that process the partitions of the data-set using key/value pairs to generate a set of intermediate results, and (ii) Reduce tasks that merge all intermediate values associated with the same intermediate key. Hadoop uses the Hadoop Distributed File System (HDFS), an implementation of the Google Filesystem [16], to share data amongst the distributed tasks in the system. HDFS splits and stores files as fixed-size blocks (except for the last block).
Hadoop has a master-slave architecture (Figure 2), with a unique master host and multiple slave hosts, typically configured as follows. The master host runs two daemons: (1) the JobTracker, which schedules and manages all of the tasks belonging to a running job; and (2) the NameNode, which manages the HDFS namespace, and regulates access to files by clients (which are typically the executing tasks).
Each slave host runs two daemons: (1) the TaskTracker, which launches tasks on its host, based on instructions from the JobTracker; the TaskTracker also keeps track of the progress of each task on its host; and (2) the DataNode, which serves data blocks (that are stored on its local disk) to HDFS clients.
Hadoop uses the Java-based log4j logging utility to capture logs of Hadoop's execution on every host. log4j is a commonly used mechanism that allows developers to generate log entries by inserting statements into the code at various points of execution. By default, Hadoop's log4j configuration generates a separate log for each of the daemons- the JobTracker, NameNode, TaskTracker and DataNode-each log being stored on the local file-system of the executing daemon (typically, 2 logs on each slave host and 2 logs on the master host).
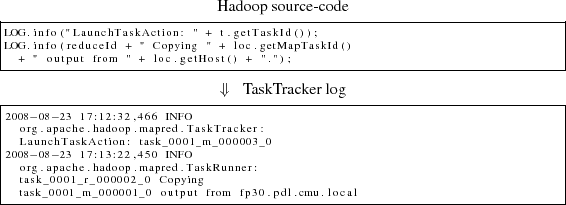
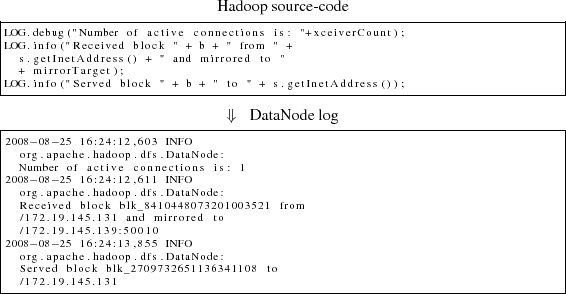
Typically, logs (such as syslogs) record events in the system, as well as error messages and exceptions. Hadoop's logging framework is somewhat different since it also checkpoints execution because it captures the execution status (e.g., what percentage of a Map or a Reduce has been completed so far) of all Hadoop jobs and tasks on every host. Hadoop's default log4j configuration generates time-stamped log entries with a specific format. Figure 3 shows a snippet of a TaskTracker log, and Figure 4 a snippet of a DataNode log.
 |
To demonstrate Salsa's approach, we focus on the logs generated by Hadoop's TaskTracker and DataNode daemons. The number of these daemons (and, thus, the number of corresponding logs) increases with the size of a Hadoop cluster, inevitably making it more difficult to analyze the associated set of logs manually. Thus, the TaskTracker and DataNode logs are attractive first targets for Salsa's automated log-analysis.
At a high level, each TaskTracker log records events/activities related to the TaskTracker's execution of Map and Reduce tasks on its local host, as well as any dependencies between locally executing Reduces and Map ouputs from other hosts. On the other hand, each DataNode log records events/activities related to the reading or writing (by both local and remote Map and Reduce tasks) of HDFS data-blocks that are located on the local disk. This is evident in Figure 3 and Figure 4.
TaskTracker log. The TaskTracker spawns a new JVM for each Map or Reduce task on its host. Each Map thread is associated with a Reduce thread, with the Map's output being consumed by its associated Reduce. The Map and Reduce tasks are synchronized to the MapReduceCopy and ReduceCopy activities in each of the two types of tasks, when the Map task's output is copied from its host to the host executing the associated Reduce.
The Maps on one node can be synchronized to a Reduce on a different node-SALSA derives this distributed control-flow across all Hadoop hosts in the cluster by collectively parsing all of the hosts' TaskTracker logs. Based on the TaskTracker log, SALSA derives a state-machine for each unique Map or Reduce in the system. Each log-delineated activity within a task corresponds to a state.
DataNode log. The DataNode daemon runs three main
types of data-related threads: (i) ReadBlock, which serves blocks
to HDFS clients, (ii) WriteBlock, which receives blocks written by
HDFS clients, and (iii) WriteBlock_Replicated, which receives blocks
written by HDFS clients that are subsequently transferred to another
DataNode for replication. The DataNode daemon runs in its own
independent JVM, and the daemon spawns a new JVM thread for each
thread of execution. Based on the DataNode log,
SALSA derives a state-machine for each of the unique data-related threads
on each host. Each log-delineated activity within a data-related
thread corresponds to a state.
SALSA can uniquely delineate the starts and ends of key activities (or states) in the TaskTracker logs. Table 1 lists the tokens that we use to identify states in the TaskTracker log. [MapID] and [ReduceID] denote the identifiers used by Hadoop in the TaskTracker logs to uniquely identify Maps and Reduces.
The starts and ends of the ReduceSort and ReduceUser states in the Reduce task were not identifiable from the TaskTracker logs; the log entries only identified that these states were in progress, but not when they had started or ended. Additionally, the MapCopy processing activity is part of the Map task as reported by Hadoop's logs, and is currently indisguishable.
SALSA was able to identify the starts and ends of the data-related threads in the DataNode logs with a few provisions: (i) Hadoop had to be reconfigured to use DEBUG instead of its default INFO logging level, in order for the starts of states to be generated, and (ii) all states completed in a First-In First-Out (FIFO) ordering. Each data-related thread in the DataNode log is identified by the unique identifier of the HDFS data block. The log messages identifying the ends of states in the DataNode- logs are listed in Table 2.
A data-flow dependency exist between two hosts when an activity on one host requires transferring data to/from another node. The DataNode daemon acts as a server, receiving blocks from clients that write to its disk, and sending blocks to clients that read from its disk. Thus, data-flow dependencies exist between each DataNode and each of its clients, for each of the ReadBlock and WriteBlock states. SALSA is able to identify the data-flow dependencies on a per-DataNode basis by parsing the hostnames jointly with the log-messages in the DataNode log.
Data exchanges occur to transfer outputs of completed Maps to their associated Reduces in the MapCopy and ReduceCopy phases. This dependency is captured, along with the hostnames of the source and destination hosts involved in the Map-output transfer. Tasks also act as clients of the DataNode in reading Map inputs and writing Reduce outputs to HDFS. However, these activities are not recorded in the TaskTracker logs, so these data-flow dependencies are not captured.
We extract multiple statistics from the log data, based on SALSA's derived state-machine approach. We extract statistics for the following states: Map, Reduce, ReduceCopy and ReduceMergeCopy.
![]() Histograms and average of duration of unidentified,
concurrent states, with events coalesced by time, allowing for events
to superimpose each other in a time-series.
Histograms and average of duration of unidentified,
concurrent states, with events coalesced by time, allowing for events
to superimpose each other in a time-series.
![]() Histograms and exact task-specific duration of states, with
events identified by task identifer in a time-series;
Histograms and exact task-specific duration of states, with
events identified by task identifer in a time-series;
![]() Duration of completed-so-far execution of ongoing
task-specific states.
Duration of completed-so-far execution of ongoing
task-specific states.
We cannot get average times for ReduceReduce and ReduceSort because these have no well-defined start and termination events in the log.
For each DataNode and TaskTracker log, we can determine the number of each of the states being executed on the particular node at each point in time. We can also compute the durations of each of the occurrences of each of the following states: (i) Map, ReduceCopy, ReduceMergeCopy for the TaskTracker log, and (ii) ReadBlock, WriteBlock and WriteBlock_Replicated for the DataNode log.
On the data-flow side, for each of the ReadBlock and WriteBlock states, we can identify the end-point host involved in the state, and, for each of the ReduceCopy states, the host whose Map state was involved. However, we are unable to compute durations for UserReduce and ReduceSort because these have no well-defined start and termination events in the logs.
|
We analyzed traces of system logs from a 6-node (5-slave, 1-master) Hadoop 0.12.3 cluster. Each node consisted of an AMD Opeteron 1220 dual-core CPU with 4GB of memory, Gigabit Ethernet, and a dedicated 320GB disk for Hadoop, and ran the amd64 version Debian/GNU Linux 4.0. We used three candidate workloads, of which the first two are commonly used to benchmark Hadoop:
![]() RandWriter : write 32 GB of random data to disk;
RandWriter : write 32 GB of random data to disk;
![]() Sort : sort 3 GB of records;
Sort : sort 3 GB of records;
![]() Nutch : open-source distributed web crawler for
Hadoop [13] representative of a real-world workload
Nutch : open-source distributed web crawler for
Hadoop [13] representative of a real-world workload
Each experiment iteration consisted of a Hadoop job lasting approximately 20 minutes. We set the logging level of Hadoop to DEBUG, cleared Hadoop's system logs before each experiment iteration, and collected the logs after the completion of each experiment iteration. In addition, we collected system metrics from /proc to provide ground truth for our experiments.
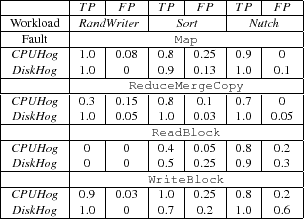
Target failures. To illustrate the value of SALSA for
failure diagnosis in Hadoop, we injected three failures into Hadoop,
as described in Table 3. A persistent failure
was injected into 1 of the 5 slave nodes midway through each
experiment iteration.
We surveyed real-world Hadoop problems reported by users and developers in 40 postings from the Hadoop users' mailing list from Sep-Nov 2007. We selected two candidate failures from that list to demonstrate the use of SALSA for failure-diagnosis.
We present automatically generated visualizations of Hadoop's aggregate control-flow and data-flow dependencies, as well as a conceptualized temporal control-flow chart. These views were generated offline from logs collected for the Sort workload in our experiments. Such visualization of logs can help operators quickly explain and analyze distributed-system behavior.
![\includegraphics[width=3in]{sort-tasktracker-cpuhog}](img20.png)
|
Aggregate control-flow dependencies
(Figure 6).
The key point where there are inter-host dependencies in Hadoop's
derived control-flow model for the TaskTracker log is the
ReduceCopy state, when the ReduceCopy on the
destination host for a Map's output is started only when the source
Map has completed, and the ReduceCopy depends on the
source Map copying its map output. This visualization captures
dependencies among TaskTrackers in a Hadoop cluster, with the
number of such ReduceCopy dependencies between each pair of
nodes aggregated across the entire Hadoop run. As an example, this
aggregate view can reveal hotspots of communication, highlighting
particular key nodes (if any) on which the overall control-flow of
Hadoop's execution hinges. This also visually captures the equity (or
lack thereof) of distribution of tasks in Hadoop.
![\includegraphics[width=3in]{sort-datanode-cpuhog}](img22.png)
|
Aggregate data-flow dependencies (Figure 8 ).
The data-flows in Hadoop can be characterized by the number of blocks
read from and written to each DataNode. This visualization is based
on an entire run of the Sort workload on our cluster, and
summarizes the bulk transfers of data between each pair of nodes. This
view would reveal any imbalances of data accesses to any DataNode
in the cluster, and also provides hints as to the equity (or lack
thereof) of distribution of workload amongst the Maps and
Reduces.
Temporal control-flow dependencies (Figure 7).
The control-flow view of Hadoop extracted from its logs can be
visualized in a manner that correlates state occurrences
causally. This visualization provides a time-based view of Hadoop's
execution on each node, and also shows the control-flow dependencies
amongst nodes. Such views allow for detailed, fine-grained tracing of
Hadoop execution through time, and allow for inter-temporal causality
tracing.
 |
Intuition. For each task and data-related thread, we can compute
the histogram of the durations of its different states in the derived
state-machine view. We have observed that the histograms of a specific
state's durations tend to be similar across failure-free hosts, while
those on failure-injected hosts tend to differ from those of
failure-free nodes. Thus, we hypothesize that failures can be
diagnosed by comparing the probability distributions of the durations
(as estimated from their histograms) for a given state across hosts,
assuming that a failure affects fewer than ![]() hosts in a
cluster of
hosts in a
cluster of ![]() slave hosts.
slave hosts.
Algorithm. First, for a given state on each node, probability density functions (PDFs) of the distributions of durations are estimated from their histograms using a kernel density estimation with a Gaussian kernel [17] to smooth the discrete boundaries in histograms. Then, the difference between these distributions from each pair of nodes is computed as the pair-wise distance between their estimated PDFs. The distance used was the square root of the Jensen-Shannon divergence, a symmetric version of the Kullback-Leibler divergence [6], a commonly-used distance metric in information theory to compare PDFs.
Then, we constructed the matrix ![]() , where
, where
![]() is the distance between the estimated distributions on nodes
is the distance between the estimated distributions on nodes ![]() and
and
![]() . The entries in
. The entries in ![]() are compared to a
are compared to a ![]() . Each
. Each
![]() indicates a potential problem at nodes
indicates a potential problem at nodes
![]() , and a node is indicted if at least half of its entries
, and a node is indicted if at least half of its entries
![]() exceed
exceed ![]() .
.
Algorithm tuning. ![]() is used for the
peer-comparison of PDFs across hosts; for higher values of
is used for the
peer-comparison of PDFs across hosts; for higher values of
![]() , greater differences must be observed between PDFs
before they are flagged as anomalous. By increasing
, greater differences must be observed between PDFs
before they are flagged as anomalous. By increasing ![]() , we
can reduce false-positive rates, but may suffer a reduction in true
positive rates as well.
, we
can reduce false-positive rates, but may suffer a reduction in true
positive rates as well. ![]() is kept constant for each
(workload, metric) combination, and is tuned independently of the
failure injected.
is kept constant for each
(workload, metric) combination, and is tuned independently of the
failure injected.
We evaluated our initial failure-diagnosis techniques based on our
derived models of Hadoop's behavior, by examining the rates of true-
and false-positives of the diagnosis on hosts in our
fault-injected experiments, as described in
§ 6. True-positive rates are
computed as:
We did not indict any nodes using ReadBlock's durations on RandWriter . By design, the RandWriter workload has no ReadBlock states since its only function is to write data blocks. Hence, it is not possible to perform any diagnosis using ReadBlock states on the RandWriter workload. Also, ReduceMergeCopy on RandWriter is a disk-intensive operation that has minimal processing requirements. Thus, CPUHog does not significantly affect the ReduceMergeCopy operation, as there is little contention for the CPU between the failure and the ReduceMergeCopy operations. However, the ReduceMergeCopy operation is disk-intensive, and is affected by the DiskHog .
We found that DiskHog and CPUHog could manifest in a correlated manner on some metrics. For the Sort workload, if a failure-free host attempted to read a data block from the failure-injected node, the failure would manifest on the ReadBlock metric at the failure-free node. By augmenting this analysis with the data-flow model, we improved results for DiskHog and CPUHog on Sort , as discussed in § 8.3.
Peer-comparison techniques are poor at diagnosing correlated failures across hosts, e.g., ReadBlock durations failed to diagnose DiskHog on the Sort workload. In such cases, our original algorithm often indicted failure-free nodes, but not the failure-injected nodes.
We augmented our algorithm using previously-observed
states with anomalously long durations, and superimposing the
data-flow model. For a Hadoop job, we identify a state as an outlier
by comparing the state's duration with the PDF of previous durations
of the state, as estimated from past histograms. Specifically, we
check whether the state's duration is greater than the
![]() -percentile of this estimated PDF. Since each DataNode
state is associated with a host performing a
read and another (not necessarily different) host performing the
corresponding write, we can count the number of anomalous states that
each host was associated with. A host is then indicted by this
technique if it was associated with at least half of all the anomalous
states seen across all slave hosts.
-percentile of this estimated PDF. Since each DataNode
state is associated with a host performing a
read and another (not necessarily different) host performing the
corresponding write, we can count the number of anomalous states that
each host was associated with. A host is then indicted by this
technique if it was associated with at least half of all the anomalous
states seen across all slave hosts.
Hence, by augmenting the diagnosis with data-flow information, we were
able to improve our diagnosis results for correlated failures. We
achieved true- and false-positive rates, respectively, of ![]() for the CPUHog and
for the CPUHog and ![]() for the DiskHog failures on the
ReadBlock metric.
for the DiskHog failures on the
ReadBlock metric.
SALSA analyzes system logs to derive state-machine views, distributed control-flow and data-flow models and statistics of a system's execution. These different views of log data can be useful for a variety of purposes, such as visualization and failure diagnosis. We present SALSA and apply it concretely to Hadoop to visualize its behavior and to diagnose documented failures of interest.We also initiated some early work to diagnose correlated failures by superimposing the derived data-flow models on the control-flow models.
For our future directions, we intend to correlate numerical OS/network-level metrics with log data, in order to analyze them jointly for failure diagnosis and workload characterization. We also intend to automate the visualization of the causality graphs for the distributed control-flow and data-flow models. Finally, we aim to generalize the format/structure/content of logs that are amenable to SALSA's approach, so that we can develop a log-parser/processing framework that accepts a high-level definition of a system's logs, using which it then generates the desired set of views.
This document was generated using the LaTeX2HTML translator Version 2002-2-1 (1.71)
Copyright © 1993, 1994, 1995, 1996,
Nikos Drakos,
Computer Based Learning Unit, University of Leeds.
Copyright © 1997, 1998, 1999,
Ross Moore,
Mathematics Department, Macquarie University, Sydney.
The command line arguments were:
latex2html -split 0 -show_section_numbers -local_icons -no_navigation salsa-tan-wasl08_html
The translation was initiated by Jiaqi on 2008-11-13
![\includegraphics[width=3in]{salsa-approach}](img3.png)
![\includegraphics[width=3in]{salsa-hadoop}](img13.png)
![\includegraphics[width=3in]{salsa-hadoop-control-flow}](img16.png)
![\includegraphics[width=3.1in]{salsa-visualization}](img21.png)