
Philip J. Guo and Dawson Engler
Stanford University
We present a study of how Linux kernel developers respond to bug reports issued by a static analysis tool. We found that developers prefer to triage reports in younger, smaller, and more actively-maintained files (§2), first address easy-to-fix bugs and defer difficult (but possibly critical) bugs (§3), and triage bugs in batches rather than individually (§4). Also, although automated tools cannot find many types of bugs, they can be effective at directing developers' attentions towards parts of the codebase that contain up to 3X more user-reported bugs (§5).
Our insights into developer attitudes towards static analysis tools allow us to make suggestions for improving their usability and effectiveness. We feel that it could be effective to run static analysis tools continuously while programming and before committing code, to rank reports so that those most likely to be triaged are shown to developers first, to show the easiest reports to new developers, to perform deeper analysis on more actively-maintained code, and to use reports as indirect indicators of code quality and importance.
|
| ||||||||||||||||||||||||||||||||||||||||||||||||||||||||||||||||||||||||||||||||||||||||||
We used two datasets for quantitative analysis: static analysis bug reports and source code revision history.
We obtained static analysis results from the Coverity Scan project [5], which uses a commercial tool called Coverity Prevent to find bugs in open source C, C++, and Java projects. Coverity reports its results in an online bug database and tracks if and when developers triage, verify, and fix those bugs. When a developer triages a bug report, he/she tries to determine the veracity of the report and then changes its status in the database from un-triaged to true bug, false positive, or, if he/she gives up without reaching a definitive conclusion, to unsure.
We obtained 2,125 bug reports produced by scans run between February 2006 and December 2007. Each report pinpoints a potential bug within a .c source file in the Linux kernel codebase. The initial scan on Feb 24, 2006 created 981 reports, and the 76 subsequent scans run periodically between then and December 2007 created 1,144 additional reports.
To get development histories for files affected by Coverity Scan reports, we mined version control data from the BitKeeper and GIT Linux kernel source code management repositories, spanning February 2002 to December 2007. We recorded when each file was added to the codebase and detailed information about each committed patch (patch size, date, author, files affected).
To corroborate our quantitative findings and to add qualitative insights, we sent out an informal email questionnaire to the primary Linux kernel developers mailing list. In that questionnaire [7], we stated each of our findings (worded identically to how it appears in this paper) and asked developers to present reasons why they agreed or disagreed with it based upon their experiences and intuitions. We received 4 responses and will quote their authors as developers A, B, C, and D due to requests for anonymity. We got the opinions of some veteran developers: Developer A has triaged the most Coverity Scan reports out of all 26 developers who have triaged reports, and developers A and B are both in the 99th percentile in terms of numbers of patches written for the Linux kernel.
Result 1: Checker type is the most important factor in determining
whether a bug report will be triaged
Coverity Prevent checks for a dozen types of generic C code bugs, such as buffer overflows and null pointer dereferences (the Coverity Open Source Report [5] describes all types in detail).
Table 1 shows percents of triaged reports (triage rate), which vary greatly across checker types. All developers who responded to our questionnaire agreed that checker type most strongly determines whether they triage a report; the one who triaged the most reports emphasized,
"I always sort the reports by report type and don't care which files they are in." (Dev A)
We corroborated these intuitions by building a predictive model using all factors in this section and noting that checker type was by far the strongest predictor of whether a report would be triaged; we describe our model's details in a separate technical report [8].
One reason why reports from certain checker types are triaged more frequently is that they find more severe bugs. Considering the top 4 checkers in Table 1, buffer overruns lead to security vulnerabilities, reads of uninitialized values lead to non-deterministic failures, and dead code bugs often indicate serious logic errors arising from the developer's misunderstanding of what ought to be able to execute under which exact (sometimes multiply-nested) conditions.
In contrast, reports from certain checkers are triaged less frequently because they are harder to diagnose:
"I have looked at a few coverity defects and skipped over them because a) they looked too hard to diagnose b) They looked like false positives but I didn't have enough knowledge about the code to be positive" (Dev C)
Specifically, the more code a developer must read when investigating a bug report, the more likely he/she will skip that report. Checkers for unsafe uses of null/negative function return values had low triage rates, perhaps because they require developers to look inter-procedurally to assess whether the called function can return a null or negative value during actual execution.
Also, developers are reluctant to triage reports from checkers whose reports they have marked as false positives. There is an inverse correlation between false positive rate and triage rate: a Spearman's rank correlation1 of -0.49. In particular, the 3 checkers with the highest false positive rates also had the lowest triage rates.
To show that triage rates don't vary much across scans, we
calculated separate rates for the initial scan and for all 76 subsequent
scans taken together. The relative rankings of checkers remained fairly
consistent across the two populations, with a Spearman's rank
correlation of 0.79. For this calculation, we
excluded the 2 checkers with the highest false positive rates
(√ symbol) due to their aberrant drop-offs, which
Result 8 will discuss, and checkers
with too few reports ( symbol).
Result 2: Bug reports in younger files are more likely to be triaged
From 2002 to 2007, the Linux codebase grew linearly by 173 new files each month (on average, 326 files were added and 153 deleted each month). The linear regression line (not pictured here) fits almost perfectly, with adjusted R-squared of 0.992 (1.0 is a perfect positive linear correlation). Files are typically quite active during their first year of life, receiving up to twice as many patches during that year than during their subsequent years. Developers are more interested in bug reports for these younger, more active files than for older files:
"My gut feeling says that [result] is probably right. More often the people involved in creating those [younger] files will still be active kernel developers, and still interested in the area those files cover." (Dev B)
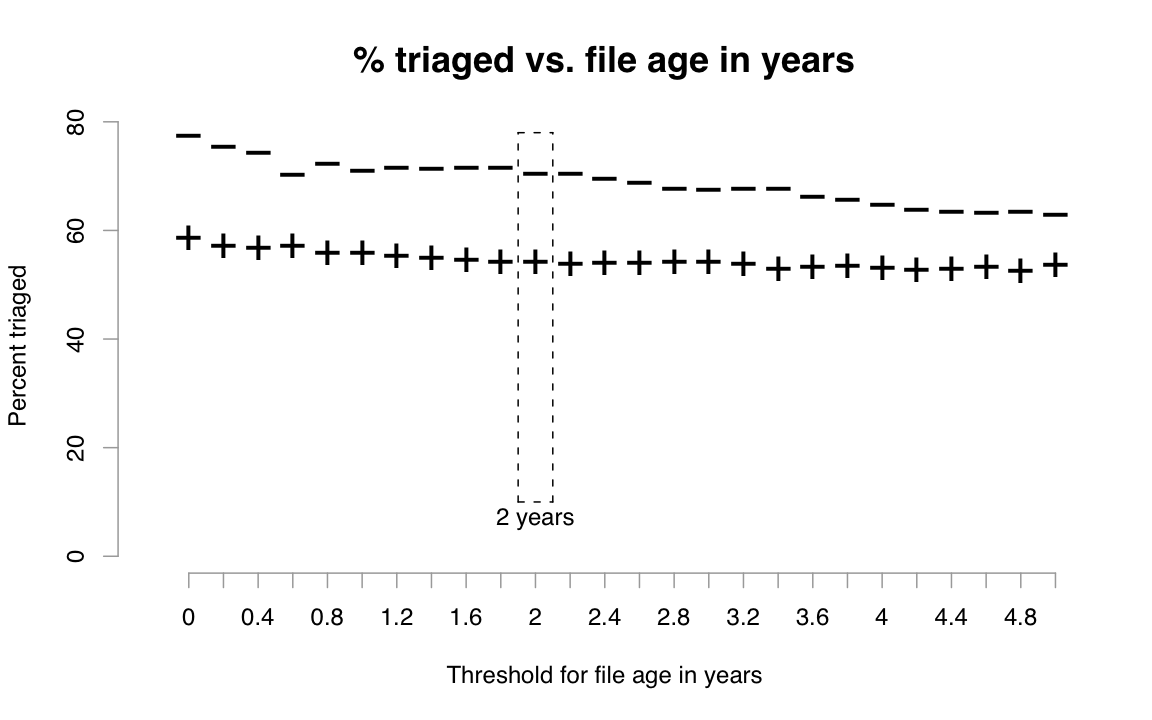 |
If we split files into two groups by their age at the time of each bug
report using some reasonable cutoff between "young" and "old" files
(say, 2 years) and then count the numbers of triaged and un-triaged
reports affecting files within each group, we find that 71%
of bug reports affecting young files are triaged, versus only 54% of
reports affecting old files. We used
a chi-square test2 to establish statistical significance: The probability a
difference of this magnitude appearing by chance is nearly zero (
 ).
).
However, the choice of 2 years as a threshold is somewhat arbitrary and could have been made to maximize the apparent disparity in triage rates, so we performed the same calculations for a wide range of age thresholds and plotted the triage rates for old and young files with each threshold along the x-axis in Figure 1. For all choices of thresholds within the range of our dataset (points along the x-axis), older files (marked by +) had a lower triage rate than younger files (marked by -). The differences are all significant with p < 0.01 in a chi-square test.
Result 3: Bug reports in smaller files are more likely to be triaged
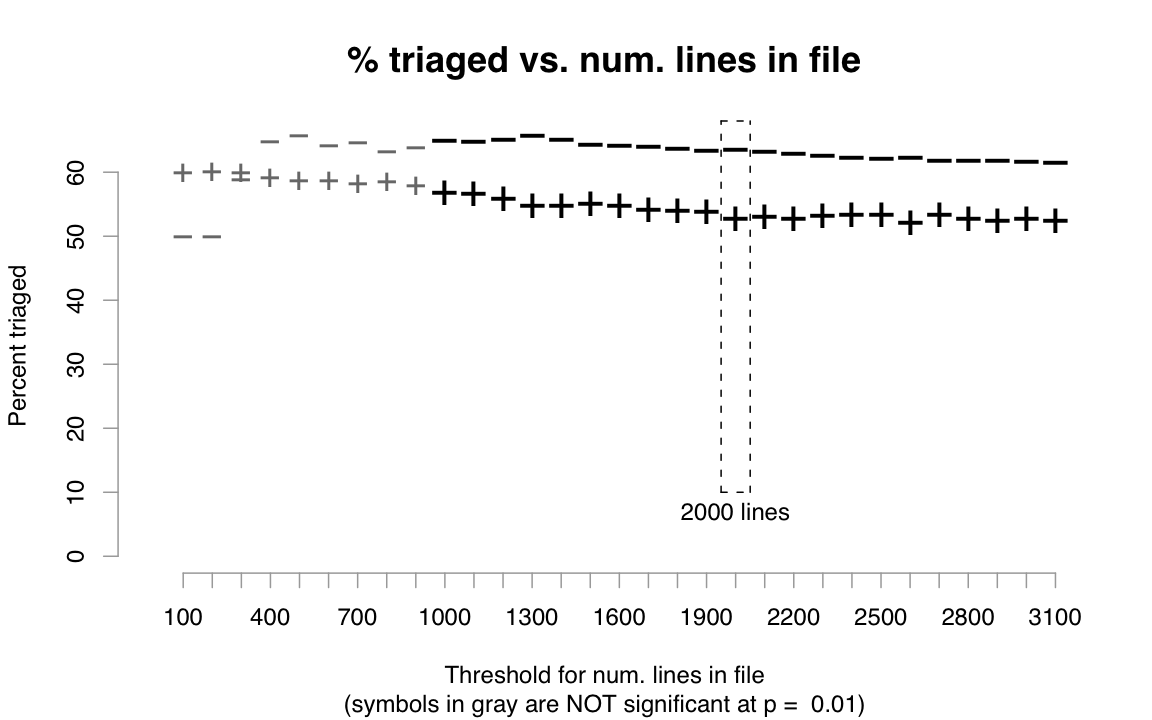
|
Our dataset consists of 14,646 .c source files added between 2002 and 2007; out of these, 68% had less than 500 lines, 86% less than 1000 lines, and 95% less than 2000 lines. Figure 2 shows that, for most thresholds, reports in smaller files (marked with -) are more likely to be triaged than those in larger files (marked with +). The disparity is not as large as that for age, though; thresholds below 1000 lines result in differences that fail to achieve statistical significance at p = 0.01 in a chi-square test (denoted by grayed-out symbols in Figure 2).
One developer offered these possible causes:
"Possibly, perhaps due to the buried in warnings syndrome. Perhaps also because smaller files are easier to modify." (Dev C)
Developers can be overwhelmed when viewing too many reports at once, becoming "buried in warnings". Smaller files usually contain fewer reports, so developers might be more willing to triage reports in those files.
Also, smaller files are easier to understand and modify since they usually have fewer functions and implement simpler and more self-contained features. When Phang et al. performed a user study where subjects triaged bug reports from a static analysis tool, they found that complexity of program paths and inter-procedural control flow made the triaging task more difficult [12].
Result 4: Triage rates vary across kernel sub-systems
|
|
Table 2 shows triage rates for files in different sub-systems (split by top-level directory). As expected, core kernel files had the highest triage rate (in addition to files in the kernel/ directory, we also included arch/ since it contains many architecture-specific core kernel files). Also, reports in core kernel and memory management (mm/) code were triaged much faster than reports in larger sub-systems that contain some more obscure code (e.g., there are numerous rarely-deployed drivers, filesystems, and network protocols). Surprisingly, driver bugs had the second highest triage rate; many drivers are rarely used and aren't actively maintained, so we expected far fewer driver bugs to be triaged.
Independence of factors: A problem that
arises when presenting a series of single-variable correlations (like
we've done in this section for factors that correlate with triage rates)
is that these factors might be cross-correlated, thereby diminishing the
validity of the results.
To show that our factors have independent effects, we built a logistic regression model3 to predict whether particular Coverity Scan reports will be triaged; we describe our model's details in a technical report [8]. We used the four factors in this section -- checker type, file age, file size, and sub-system -- in our model. We determined that all factors had independent effects by incrementally adding each one to an empty model and observing that the model's deviance (error) decreases by a statistically significant amount for all added factors (a standard technique called Analysis of Deviance). Checker type was the strongest factor because it decreased our model's deviance by the greatest amount.
Redundant factors: Other factors also
significantly correlated with triage rates, most notably the number of
patches and number of developers modifying the affected file. However,
both are highly dependent on file age: Intuitively, the longer a file
has been alive, the more opportunities it has for receiving patches and
for having more developers. Since the kernel developers in our
questionnaire responded most favorably to file age as a determiner for
whether reports are triaged and did not prefer the other two related
factors as much, we used file age in our model and discarded the other
two factors.
Discussion: Static analysis tools can
produce thousands of bug reports, but those reports are useless
unless developers triage them.
Tool makers can use factors like those described in this section to
build models to predict the likelihood that particular future reports
will be triaged. The tools can then
first show developers reports that are most likely to be triaged.
This type of ranking system is currently deployed at Google [3,13].
Result 5: The longer it takes to triage a bug report, the lower chance
of it being marked as a true bug
|
|
Table 3 shows that the longer it takes for a report to be triaged, the more likely it will be marked as unsure (veracity could not be determined) and less likely marked as a true bug. For example, 54% of reports triaged over one year after their release dates (the "≥" row) were marked as unsure, versus only 17% of reports triaged within one year ("<" row). Correspondingly, 11% of reports triaged over one year after their release dates were marked as true bug, versus 33% of those triaged within one year.
Discussion:
Without a policy forcing certain bugs to be triaged, developers
tend to triage the simplest bugs first:
"True, people first go after the low hanging fruits and complicated reports might stay untriaged." (Dev A)
Once confirmed, these quickly-triaged reports are usually easy to silence by adding a few lines of code like an extra null pointer check (the median size of a Coverity bugfix patch is 3 lines, versus 11 lines for all patches). However, these seemingly superficial bugs often indicate deeper misunderstandings of program invariants or interfaces, so the affected code should be audited more carefully. In a mailing list discussion about Coverity bugs, one developer shows concern that others are submitting quick "fixes" rather than figuring out their root causes:
"Considering the very important flow of patches you are sending these days, I have to admit I am quite suspicious that you don't really investigate all issues individually as you should, but merely want to fix as many bugs as possible in a short amount of time. This is not, IMVHO [in my very humble opinion], what needs to be done." [6]
Given these natural tendencies, it might be effective to enforce policies to make developers triage more complicated but potentially critical reports and to carefully investigate each one before submitting a patch, perhaps even requiring sign-offs from multiple triagers.
If a report isn't triaged quickly, then it might either never be triaged or be marked as unsure:
"Many maintainers have an inbox-is-todo-list mentality when it comes to bugfixes. If they receive a scan report and don't act on it quickly then it's likely it's left the inbox and left the maintainer's thoughts forever." (Dev D)
This problem of fading memories could be alleviated if reports were immediately brought to the attentions of relevant developers (e.g., those who created or recently modified the file). To do so, developers could run bug-finding tools continuously while coding (e.g., PREfast at Microsoft [11]) rather than making monolithic nightly or weekly scans over the entire codebase. Ayewah et al. suggest triaging static analysis warnings as part of the code review process [3]. Also, a bug database could periodically remind developers who are responsible for a file to look at its un-triaged bug reports.
 |
|
|
Result 6: If one report in a file is triaged, then it's likely that all
other reports in that file will be triaged
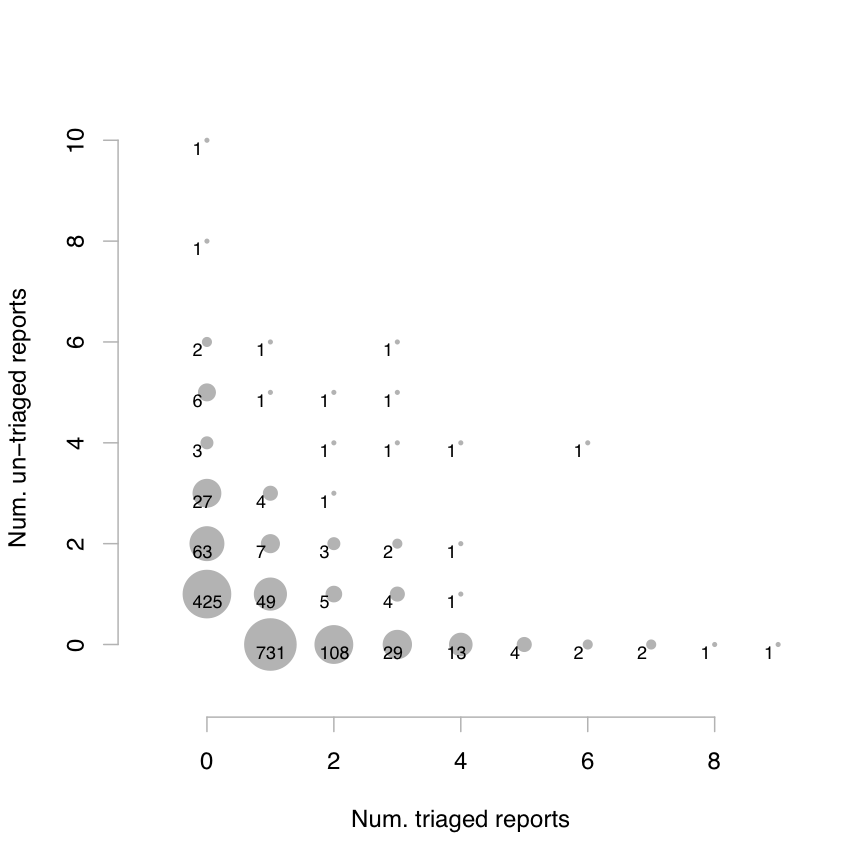
Triaged reports are clustered in space: During a particular scan, if a developer triages one report in a file, then he/she will likely triage all other reports in that file. We call one of these sessions of triaging bugs within one file during a particular scan a file-scan session.
Figure 3 visualizes this clustering: Each dot represents a collection of file-scan sessions that have a given number of triaged vs. un-triaged reports. Its salient feature is the L-shaped distribution -- there are many sessions along the vertical axis representing 0 triaged reports and along the horizontal axis representing 0 un-triaged reports. This pattern shows that either all reports in a session are triaged or left un-triaged. (Kremenek et al. used a similar diagram to visualize clustering of true bugs vs. false positives [10].)
Table 4 quantifies the amount of clustering: The probability that all reports in a session are triaged (or un-triaged) rise markedly when at least 1 or 2 reports are triaged (or un-triaged). The largest dots in Figure 3 are located at (1,0) and (0,1), representing sessions with only 1 report per file. We excluded these singleton sessions from the calculations in Table 4, since clustering is only meaningful for sessions with multiple reports.
Result 7: Triaging, verifying, and fixing reports increase the probability
of triaging future reports
Clustering also extends across time: If a report is triaged, then future reports in that same file are more likely to be triaged. Table 5 shows the probabilities of reports in a scan being triaged, given what happened to reports in the scan immediately preceding it. Only 50% of reports were triaged when no reports in the same file were triaged in the previous scan. If at least 1 previous report was triaged, then the conditional probability rises to 59%, and it increases further if those reports were marked as true bugs (67%) and were fixed (80%).
Each act of triaging a bug report shows that some developer cares about bugs in that file, and verifying and fixing bugs are even stronger indicators. In contrast, if developers are given the opportunity to triage a report but do not do so, then either it's too hard to diagnose or nobody cares about bugs in that file.
|
|
Result 8: False positives decrease the probability of triaging future reports
If developers mark reports in a particular scan as false positives, then they are less likely to triage future reports in the same file, versus had they marked them as true bugs (56% vs. 67% triaged):
"False positives tend to lower the maintainer's trust of the tool and are more likely then to let future reports from the same tool slip." (Dev D)
Looking back at Table 1, the 2 checkers with the highest false positive rates also had the largest decreases in triage rates between the initial and subsequent scans (marked with the √ symbol). Developers triaged most initial scan reports from those checkers (72%), but after encountering too many false positives, they triaged substantially fewer reports in subsequent scans.
However, the triage rate when previous reports were marked as false positives is still greater than when previous reports went un-triaged (56% vs. 50%), since the act of triaging shows that somebody cares about that file.
Discussion: To encourage adoption of
static analysis tools, it might be useful to assign the easiest reports
(those with the highest triage rates) to developers who are new to the
tool, to encourage them to keep triaging:
"The kernel is such a big project then [sic] triaging bug reports can be quite intimidating [...] Once a developer has got some confidence up in a subsystem they are more likely to step up to the plate and triage again." (Dev D)
Also, clustering of report triaging shows that developers have sustained interest in certain files and don't simply triage reports without regard to the files they are in. Frequently-triaged files likely contain more important code. In fact, triage frequency might be a better indicator of code importance than number of recent patches, since we've observed that many unmaintained files still receive trivial patches when module-wide interfaces are updated.
Once we flag which files are more important to developers, we can customize bug-finding tools to perform deeper and more precise analysis on those files, which can potentially reduce false positives.
We define a user-reported bug as one that was not reported by Coverity or Sparse [1], the two sources that comprise the vast majority of static analysis bug reports for Linux. As a proxy, we record patches that fix user-reported bugs (rather than occurrences of such bugs) since users only report symptoms and cannot pinpoint specific files as causes; in contrast, bugfix patches and static analysis reports always target specific files.
Result 9: Files and modules with more bugs found by static analysis also
contain more user-reported bugs
|
| ||||||||||||||||||||||||||||||||||||||||||||||||||||||||||||||||||||||||||||||||||||||||||||||||
The Spearman's rank correlation between the number of Coverity Scan reports in each file and the number of patches that fix user-reported bugs is 0.27, which is statistically significant but somewhat weak. It's difficult to get high Spearman correlations since most files had less than 3 reports. To get a cleaner signal, Microsoft researchers used static analysis reports to predict bug density in modules rather than in files [11]. We also calculated correlations for bugs aggregated over entire directories (1,203 total), which serve as ad-hoc kernel modules, and our correlation grew substantially to 0.56. The Microsoft study found a similar module-level correlation of 0.58 between static analysis bugs and pre-release bugs found by QA in the Windows Server 2003 codebase [11].
Surprisingly, reports that developers have marked as false positives still somewhat correlate with user-reported bugs, with a file-level correlation of 0.15 and directory-level correlation of 0.42. One possible explanation is that static analysis tools are more likely to produce false positives when analyzing more semantically-complex and convoluted code, which is more likely to contain latent functional correctness bugs that users will later report. For example, a veteran developer triaged a static buffer overrun report in an InfiniBand networking driver, marked it as a true bug, and then a day later re-marked it as a false positive, noting in the bug database:
"It's horrible, but after looking deeper, including looking at the callers, I'm now convinced it's correct (this code only gets called in 64bit kernels where longs are double the size of ints)." (Dev A)
Files like this one with code that even baffles a veteran developer probably also contain subtle correctness bugs.
Result 10: Bugs found by static analysis can predict future user-reported
bugs in the same file
Not only are numbers of Coverity and user-reported bugs correlated, but the presence of Coverity bugs can foreshadow a file having user-reported bugs in the future.
We considered all 8,137 .c files alive during the initial scan on Feb 24, 2006, to simplify calculations and to prevent biases due to files being added over time. We partitioned files into subsets based on how many reports from that initial scan affected each file. For example, the "≥ 1 reports" rows of Table 6 are for all files with at least 1 report. For each file, we counted the number of bugfix patches for user-reported bugs in the subsequent 1 month, 3 months, 6 months, 1 year, and the rest of the file's life (the "∞" column). We also counted bugfix patches over each file's entire lifetime, which takes into account patches that occurred before the initial scan.
As a sanity check, the numbers increase across each row of Table 6 because the more time elapses, the more likely it is for files to receive bugfix patches.
Scanning down each column, we can compare values across files with varying numbers of Coverity reports. More reports boosts the chances of future (fixes for) user-reported bugs, as shown by the numbers increasing down each column. Note that having at least one triaged report is a slightly better predictor than simply having one report, because triaging shows that someone is actively monitoring that file. For instance, the "1 month" column shows that 13% of files with initial scan reports had fixes for user-reported bugs in the next month, versus only 4% of files with no reports (over 3X greater). The mean number of user-reported bugs per file -- 0.17 vs. 0.06 -- was also 3X greater. This 3X increase is consistent across all time scales.
Discussion: Static analysis tools excel at finding generic errors (e.g., like those
in Table 1) but cannot usually find
higher-level functional correctness bugs like those that users report
(e.g., driver X doesn't do the right thing when fed this input).
However, results like ours and related
work on a commercial codebase at Microsoft [11] show
that static analysis tools can be useful for pointing developers towards
regions within the codebase that are more error-prone, which is
cost-effective because these tools can be run automatically and
continuously.
In fact, some kernel developers advocate using static analysis tools in exactly this manner: directing developers' attentions towards potentially buggy code:
"Coverity and similar tools are a true opportunity for us to find out and study suspect parts of our code. Please do not misuse these tools! The goal is NOT to make the tools happy next time you run them, but to actually fix the problems, once and for all. If you focus too much on fixing the problems quickly rather than fixing them cleanly, then we forever lose the opportunity to clean our code, because the problems will then be hidden." [6]
This use case could partially explain the low incidence of fixes (only 8% of triaged reports were confirmed as bugs and fixed). Developers might want to purposely leave in errors as markers for "suspect parts" of the codebase until that code can be properly audited and fixed.
To our knowledge, Google researchers did the closest related work in terms of studying developer responses to static analysis bug reports. Ayewah et al. described experiences with deploying FindBugs at Google [3], where two dedicated test engineers triaged all bug reports. In contrast, our study focuses on open source code where 26 kernel developers triaged reports. Ruthruff et al. built a logistic regression model to predict which FindBugs reports at Google were likely to be triaged or marked as false positives [13], using factors similar to those we describe in Section 2 and in our technical report [8].
Nagappan and Ball found a correlation between bugs reported by the PREfix/PREfast static analysis tools and pre-release defects found by testers within modules in Microsoft Windows Server 2003 [11]. We performed a similar analysis in Section 5 and found similar correlations, albeit using a different analysis tool and codebase.
In terms of static analysis bug reports for the Linux kernel, Chou et al. quantified distributions and lifetimes of kernel bugs found by a precursor of Coverity Prevent [4]. Kremenek et al. proposed a technique for incorporating developer feedback to filter and rank reports so as not to overwhelm triagers, and performed an evaluation on bug reports issued for kernel code [10].
Other work related to bug report triaging include prioritization and ranking of reports [9], optimizing assignments of triagers to specific reports [2], and graphical user interfaces for facilitating the triaging process [12].
We evaluated developer responses to static analysis bug reports in an open source setting where there were no organizational policies for triaging or fixing these bugs. Findings might differ in a corporate setting where static analysis is integrated into the workflow. With any empirical study, we must be cautious about over-generalizing based solely upon data analysis; trying to infer human intentions from code-related artifacts is a difficult problem. Thus, we tried to support our claims using anecdotes gathered from kernel developers. Also, similar findings from other researchers working with different tools and codebases make our results more generalizable.
We thank David Maxwell for providing the Coverity dataset, Greg Little and Derek Rayside for help with questionnaire design, kernel developers who responded to our questionnaire, Joel Brandt, Cristian Cadar, Imran Haque, David Maxwell, Derek Rayside, and our shepherd George Candea for comments on this paper and its earlier drafts. This research was supported by NSF TRUST grant CCF-0424422 and the NDSEG fellowship.
Copyright © 1993, 1994, 1995, 1996,
Nikos Drakos,
Computer Based Learning Unit, University of Leeds.
Copyright © 1997, 1998, 1999,
Ross Moore,
Mathematics Department, Macquarie University, Sydney.