Amitabha Roy
University of Cambridge
amitabha.roy@cl.cam.ac.uk
Steven Hand
University of Cambridge
teven.hand@cl.cam.ac.uk
Tim Harris
Microsoft Research
tharris@microsoft.com
The desire to extract parallelism has recently focused attention on improving concurrency control mechanisms in applications. However, programmers have few tools to help them understand the synchronisation bottlenecks that exist in their programs - for example to identify which locks are heavily contended, and whether different operations protected by the same lock are likely to conflict in practice. This kind of profiling is valuable to guide programmers in efforts towards optimising their lock-based concurrent applications, as well as to aid the design and tuning of advanced concurrency mechanisms such as hardware and software transactional memory systems. To this end, we describe the design and architecture of a prototype tool that provides insights about critical sections. Our tool is based on the Pin binary rewriting engine and works on unmodified x86 binaries. It considers both the amount of contention for a particular lock as well as the potential amount of disjoint access parallelism. We present the results of applying the tool to a representative sample of applications and benchmarks.
Lock-based programming has come in for recent criticism on the grounds of scalability, robustness and ease of use. A programmer is faced with many choices when trying to tackle a program that does not scale: should the locking be made more fine-grained, should some form of optimistic concurrency control (OCC) be tried, should lock-free solutions be implemented, or should experimental language features like atomic blocks be explored ? It is also often not clear which lock or locks are limiting scalability. Programmers currently have little support in answering these questions.
There are some properties of a critical section, which determine the possible speedups that might be obtained by finer grained synchronisation. First, the amount of contention for a lock is important: if there is no contention for a lock then modifying it cannot improve scalability. For example, Rossbach et al. showed only a 5% speedup when replacing locks in the Linux kernel with an implementation based on hardware transactional memory [9]. The second property is that even if waiting time for a lock is significant, it is possible there is no disjoint access parallelism [4] to be exploited. For example, it is very hard to optimise a critical section that increments a shared counter: all contending threads need to access the same location.
A programmer faced with the task of making their application more scalable must investigate these factors to determine the best possible approach. These properties would help decide whether it is sufficient to investigate finer grained locking or transactional memory as ``quick fixes'' -- or whether the application or algorithm needs to be rewritten.
In this paper we describe a new approach and its implementation for trying to answer these questions (Section 2). We do this by combining information from two separate execution profiles of the program. The first profile is coarse grained and only instruments the lock-acquire/release operations that a process invokes. This lets us run the program at near real-time speeds, rather than incur the overhead of using a simulated machine [7]. For server applications this lets us subject the server to real workloads (we discuss the Apache web server in Section 3.2). We post-process the timings to adjust for the overheads added by the instrumentation. The second profile instruments the program in more detail, letting us measure the quantitative properties of critical sections - e.g. the number of read/write accesses, and the locations and cachelines accessed. This lets us build a data-access model for each critical section, indicating the likelihood of conflicts between concurrent invocations. We combine the results of these two profiles to get an overall indication of the best-case speedup for the whole application through optimistic concurrency control, and to identify the ``hot'' locks that should be the focus of the programmer's attention.
Underlying this approach is the assumption that the data-access model captured with the detailed level of instrumentation is also true of the program's behaviour when running at speed. To validate this assumption we compare the predictions made by our approach to results for synthetic workloads and for the SPLASH-2 benchmark suite (Section 3). Finally, in Section 4, we contrast our approach with alternatives such as syncchar [7].
In this section we introduce our PinCS tool for profiling critical section usage. We first provide a practical example of its use, then describe the profiling methods, and finally explain our technique for analysing profiling data.
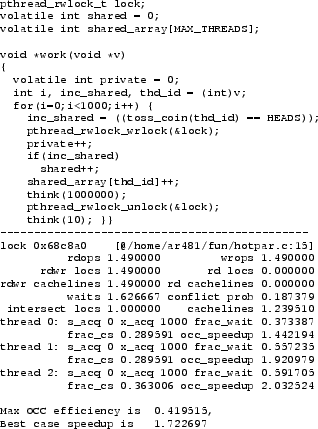
Consider the program fragment of Figure 1. Three threads execute the work function, performing 1000 iterations of the loop, each time acquiring and releasing lock. The critical section increments a thread-private counter in a global array and -- once every 2 iterations on the average -- also increments a shared variable. Finally it does private computation (``think'') while holding the lock.
The final output from PinCS is also shown in Figure 1. The tool prints the lock address (0x68c8a0) and, since debug symbols are available, the line number(s) where the lock is acquired. Next it prints attributes of the critical section: the number of read and write operations to shared data, the number of unique shared addresses seen (classified as read-write and read-only) and then the same attribute in terms of cachelines. The cache line size is determined automatically on the system where the program is run. The next output item is the amount of contention for the lock. The lock is heavily contented in this example and each thread needs to wait for 1.6 other lock holders on the average (there are two other threads contending for the lock). Next comes the conflict probability, which is the estimated probability that the critical section would have encountered a conflict if run under optimistic concurrency control. We also print the average size of the intersection (in terms of unique addresses seen) causing a conflict. Note that in the example program the size of the intersection in terms of cachelines is larger than the number of locations; this is simply because the intersection size is always one location (the global variable shared) but there are false conflicts between entries in the shared array. Finally for each thread we print the number of times the critical section is acquired in exclusive and shared modes, the fraction of thread time spent waiting for the critical section, the fraction of thread time spent in the critical section, and the expected speedup for this critical section in this thread with an ideal optimistic concurrency control implementation. We also print estimated benefits for the application as a whole that we term the maximum occ efficiency and best case speedup, described in more detail in Section 2.3.
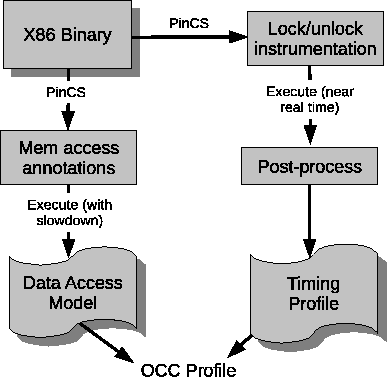
Figure 2 illustrates the operation of PinCS. We execute the program twice, once in order to generate a timing profile for the application, and a second time in order to generate a data-access model for each critical section. Both are collected by using the Pin binary instrumentation engine [5]. However, when collecting the timing model, Pin is only used to instrument lock acquire/release operations, with most of the program running uninstrumented. In contrast, when generating the data-access model, we instrument all the reads and writes within a critical section (excluding those to the lock variable), substantially perturbing execution. We then combine this detailed information from the slower memory access trace with the timing information in a post processing step, to generate the final output.
We have been careful to reduce the profiling overhead when collecting the timing model -- on a Pentium 4, with Pin v24110, we pay around 350 cycles for each lock or unlock operation we record, chiefly for saving application state when calling the instrumentation routine. As this cost may still be significant with fine-grained critical sections, we correct for it as follows:
Let ![]() be the number of entries into a critical section
be the number of entries into a critical section ![]() on
thread
on
thread ![]() . Also let
. Also let ![]() be the average number of other threads that
a thread entering that critical section needs to wait for. We denote
as
be the average number of other threads that
a thread entering that critical section needs to wait for. We denote
as ![]() as the overhead cost of instrumenting a lock or unlock call,
which can be measured on the target system;
as the overhead cost of instrumenting a lock or unlock call,
which can be measured on the target system; ![]() is paid once per thread
we must wait for, and once each for the actual lock acquire and release.
Let
is paid once per thread
we must wait for, and once each for the actual lock acquire and release.
Let ![]() be the execution time of thread
be the execution time of thread ![]() and
and
![]() be the total time that thread
be the total time that thread ![]() spends waiting for critical section
spends waiting for critical section ![]() .
Then the adjusted (primed) values are:
.
Then the adjusted (primed) values are:
We use these adjusted values for the rest of the computations. One possible problem with this approach is that the perturbation can increase the average number of contenders for the lock, since it is now held for around 350 cycles longer than before. However, as we show in Section 3.1, the results gathered with this model agree well with previously reported speedups.
The most challenging analysis phase is making predictions for OCC.
We use a conflict model that is similar to von Praun's
dependence analysis [11].
Given two traces from the same critical section, say B and A,
A would have seen a conflict from a concurrent
execution of B if B writes to a location accessed by A. This is a difference from von Praun's
model where a dependence only occurs when A would read from a location
written to by B. Our model of computation assumes no global
entity such as a scheduler. Instead critical sections are retried under
optimistic concurrency control until they succeed. Thus we must track both
read-write and write-write conflicts. We ignore the conflict case where
A writes to a location read by B since this is not seen as a conflict
by the execution of A (assuming invisible readers). Also, no conflict
is seen if A finishes before B. Assuming symmetry,
we use a 50% probability for the event that A finishes before B.
Thus, given traces A and B, we can compute the probability that
A sees a conflict from a concurrent execution of B:
![]() .
.
Let
![]() be the set of traces for a critical section on thread
be the set of traces for a critical section on thread ![]() .
We use the notation
.
We use the notation
![]() for the thread that the trace
for the thread that the trace ![]() belongs to. For any particular trace
belongs to. For any particular trace ![]() , define
, define
![]() to be a set of traces
of the same critical section on thread
to be a set of traces
of the same critical section on thread ![]() which are closest in execution time
to this trace (we have a total order on critical section entries
in the log file); we discuss the sizing of this set later.
which are closest in execution time
to this trace (we have a total order on critical section entries
in the log file); we discuss the sizing of this set later.
Using
![]() , we can compute the probability
, we can compute the probability
![]() that this trace will see a conflict from
another simultaneously running copy of the critical section.
that this trace will see a conflict from
another simultaneously running copy of the critical section.
We then average this over all traces for that critical section, and
over all threads, to compute the final pairwise probability of
conflict for the critical section ![]() :
:
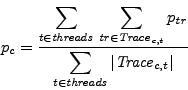
Since ![]() other copies will run simultaneously when the measured
contention for the critical section is
other copies will run simultaneously when the measured
contention for the critical section is ![]() , the probability of
seeing a conflict in critical section
, the probability of
seeing a conflict in critical section ![]() is:
is:
The intersection between traces is computed using a Bloom filter (with
a false positive setting of 0.001). The final results are sensitive
to the size of the window
![]() only when memory
addresses accessed by different dynamic executions of the critical
section vary over time, particularly when dynamic data structures are
accessed. We set it to 2 to take into account the trace interleaved
before and after the current one and use this value throughout the
rest of this paper.
only when memory
addresses accessed by different dynamic executions of the critical
section vary over time, particularly when dynamic data structures are
accessed. We set it to 2 to take into account the trace interleaved
before and after the current one and use this value throughout the
rest of this paper.
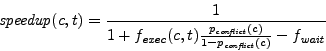
Given the fraction of thread execution time spent waiting
for a critical section ![]() by a thread
by a thread ![]() ,
,
![]() , and the
fraction of time actually spent in the critical section,
, and the
fraction of time actually spent in the critical section,
![]() ,
we obtain a bound on the speedup using Amdahl's law.
We assume that OCC is an optimisation that can be applied to remove the wait
and instead replace it with repeated executions of the critical section, until
successful execution without conflict. The number of such attempts is a function
of the conflict probability and is given by
,
we obtain a bound on the speedup using Amdahl's law.
We assume that OCC is an optimisation that can be applied to remove the wait
and instead replace it with repeated executions of the critical section, until
successful execution without conflict. The number of such attempts is a function
of the conflict probability and is given by
![]() .
We thus arrive at our estimated speedup for this critical section and
thread when using OCC.
.
We thus arrive at our estimated speedup for this critical section and
thread when using OCC.
Note that
![]() is smaller than 1 when a high conflict rate
causes the cost of retrying the critical section to outweigh the
benefits of eliding the wait.
is smaller than 1 when a high conflict rate
causes the cost of retrying the critical section to outweigh the
benefits of eliding the wait.
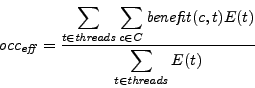
We also try to estimate the overall benefit to the application from an ideal OCC. This is difficult, since threads are rarely balanced in an application (in particular, pthread mutexes favour convoying-avoidance over fairness leading to threads being favoured if they repeatedly acquire a lock). Also, in many applications, threads wait for each other at points like barriers. OCC would reduce this wait, but the potential impact is very hard to compute. However our objective is not to accurately estimate the speedup of a particular OCC based implementation. Instead, we merely aim to give the programmer a sense of the overall benefit for the application. The metric should tell the programmer whether it is at all worthwhile to apply finer grained locking or transactional memory to the application or whether an algorithm redesign should be considered for greater concurrency. Since OCC can actually hurt performance in some cases, we consider only those critical section where the benefit is positive, thus assuming intelligent application of OCC.
To enable this we define the
benefit from OCC for a critical section ![]() and a thread
and a thread ![]() as the fraction of time that could be saved using OCC, or 0 otherwise.
as the fraction of time that could be saved using OCC, or 0 otherwise.
Next, we define
![]() ,
which is the fraction of saved cpu time (considered across all threads)
that would be saved by applying OCC (or finer grained locking). This is referred to
as maximum occ efficiency in the tool output of Figure 1.
,
which is the fraction of saved cpu time (considered across all threads)
that would be saved by applying OCC (or finer grained locking). This is referred to
as maximum occ efficiency in the tool output of Figure 1.
Finally we assume that this
![]() fraction applies to the application
time as a whole and estimate the application speedup, referred to as
best case speedup in the tool output of Figure 1.
fraction applies to the application
time as a whole and estimate the application speedup, referred to as
best case speedup in the tool output of Figure 1.
Red-black trees. We used PinCS to profile two red-black tree implementations. The first implementation uses an MCS fair lock [6] for protecting concurrent accesses to the tree. We confirmed that the number of data accesses recorded by PinCS agreed with the number performed by the application; these are well known analytical properties of red black trees. Next, we aimed to validate the speedup numbers computed by PinCS. For this we used two variants of the red-black tree implementation using Object Software Transactional Memory (OSTM) [3]: one just using STM (so we could measure an actual speedup), and the other using locks around the transactions (which we would profile with PinCS). Figure 3 shows the speedup for increasing number of threads and Figure 4 the speedup for increasing tree sizes; as is well known, more threads and deeper trees both mean more available speedup. The predicted speedups agree reasonably well with experiment. This gives us confidence in the model as well as the tool.
SPLASH-2. We profiled five applications from SPLASH-2 [12], still popular in the computer architecture community for hardware transactional memory research. We replicate Rajwar's [8] benchmark configuration in order to be able to compare our predicted speedups with those reported for transactional lock removal in their simulated 16-way CMP machine. Although there are many differences between their simulated system and our native execution environment, we expect our predicted speedups to broadly agree.
| Application | Parameters | Speedup (PinCS) | Speedup [8] |
| Barnes | 4k bodies | 1.22 | 1.16 |
| Cholesky | tk14.O | 1.00 | 1.05 |
| Ocean-cont | x1026 | 1.00 | 1.02 |
| Radiosity | -room batch | 1.35 | 1.47 |
| Water-nsq | 512 mols,3 iters | 1.02 | 1.01 |
As the table shows, the results are in broad agreement. Barnes is reported as having significantly higher speedup than in Rajwar's work. On closer examination we found that this was due to contention on an external table of locks protecting nodes in a tree. In turns out that this is a known problem with Barnes, and that Rajwar specifically avoided this by using a different version of the program with in-situ locks in his work; unfortunately this version is not present in the publicly available SPLASH-2 suite.
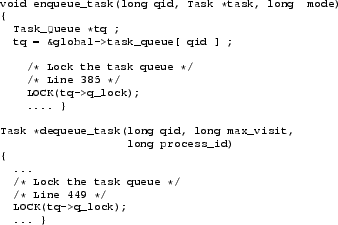
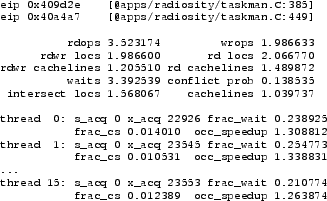
For Radiosity, PinCS identified the code manipulating the task queue (the enqueue_task and dequeue_task functions in taskman.C, Figure 5) as having the most potential for optimisation. As the tool output in Figure 6 shows, threads spend as much as 20% of their time waiting for the lock while there is only a 10% probability of conflict. This is because the thread owning a particular task queue tries to enqueue work at the head while other threads stealing work try to dequeue work from the tail.
Apache is a widely used webserver with a complex source base of more than 338000 lines spread over 829 files. We profiled an unmodified binary of apache on our testbed. We exercised the webserver with the httperf tool, doing 150000 requests over 15 simultaneous connections (we reserved one of the 16 hardware threads for the software thread accepting connections). Even when running with memory access tracing for the critical sections enabled, the test took just under a minute to run, meaning larger workloads are well within reach. We profiled the binary for pthread locks, which form the basis for concurrency in the webserver. Not surprisingly we found that the tool reported no available speedup. Applications such as apache are extremely well tuned for concurrency. Most of the threads only need locks to acquire resources during startup and run almost independently after that. The only lock showing some contention (about 2 threads contending) is the lock that protects the fdqueue. This queue is used to transfer incoming requests to threads for service. However the fraction of time spent waiting for the lock is negligible, making it an unsuitable candidate for optimisation.
There have been a number of similar efforts to profile critical sections and lock performance. Tools such as syncchar [7] and methods such as dependence-analysis [11] have been used to measure conflicts and dependence between dynamic instances of critical sections. The former uses a simulator while the latter uses Pin. There have been efforts to profile critical sections of userspace applications with regard to suitability for transactional memory [2]. On the flip side there are tools that measure timing and contention related properties of a critical section, an example being the lockstat utility in the linux kernel. Only von Praun [11] uses conflict probability measurements to predict parallelism in applications. However von Praun's work does not take into account lock contention. We believe that this is important since uncontended critical sections cannot be exploited regardless of how much disjoint access parallelism lies behind them. To the best of our knowledge PinCS is the the only tool that combines timing information together with traces collected on applications running natively at near full speed to predict speedups under optimistic concurrency control.
Finally, PinCS is complementary to our research into adaptive concurrency control mechanisms. It can act as a stage in profile guided optimisation by choosing locks that should be elided using mechanisms such as software lock elision [10], while leaving locks that would show little benefit unchanged.
This document was generated using the LaTeX2HTML translator Version 2008 (1.71)
Copyright © 1993, 1994, 1995, 1996,
Nikos Drakos,
Computer Based Learning Unit, University of Leeds.
Copyright © 1997, 1998, 1999,
Ross Moore,
Mathematics Department, Macquarie University, Sydney.
The command line arguments were:
latex2html -reuse 0 -split 0 -show_section_numbers -local_icons -no_navigation hotpar.tex
The translation was initiated by Amitabha Roy on 2009-02-27